The Status Reports tab of the Home Page workspace allows Project Managers to keep track of their project's Status in the form of reports, which can then be printed and shared with other stakeholders.
The Project’s status is often determined by calculated indicators (e.g., comparing the Total Cost with the Baseline Cost). However, status can also be based on observations and feelings, which are more subjective. The Status Reports tab focuses on the latter, and also keeps track of the Project’s status over time throughout the life of the Project (history).
The Status Report feature provides users with a variety of tools that allow the user to efficiently fill in all the subjective information regarding the project:
Indicators
Description sections
Key project information
Status Report Preferences
Indicators and Description sections can be customized by the Administrator in the System Settings workspace, Project Settings folder, Status Report Options tab.
Once the information is entered, the user has the opportunity to print a full report, associating the information with the actual project data, depending on the choices made by the user in the Status Report Preferences.
Once at least one Status Report has been submitted, the Last Submitted Report view will be displayed, allowing the user to easily review the last three submitted reports.
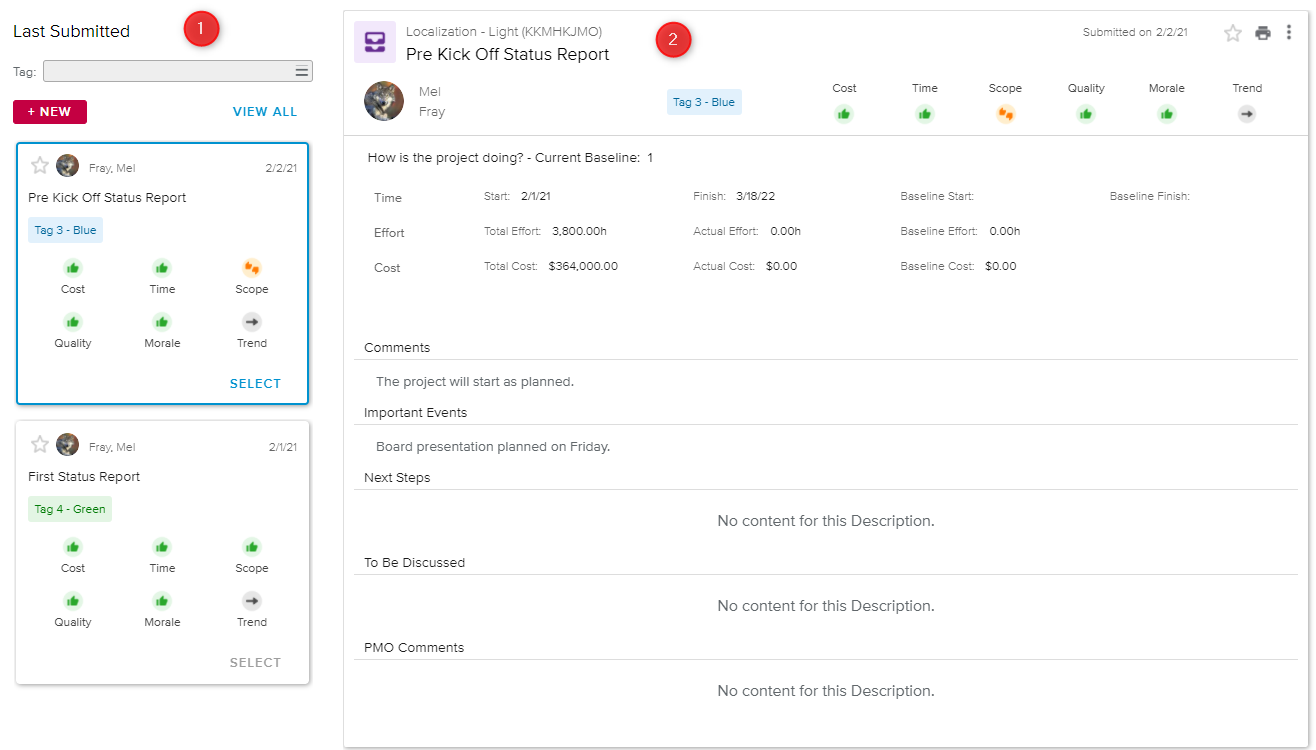
The Last Submitted Report view is made up of:
The Last Submitted panel, which displays the three last submitted reports in the form of cards, and
The Submitted Status Report Details view, which displays the information regarding the report selected in the Last Submitted panel.
The Last Submitted panel displays the three last submitted reports in the form of cards.
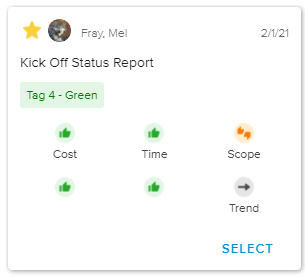
Each card provides the following information:
 | Favorite | Indicates whether the Status Report is marked as "Favorite" (yellow icon) or not (grey icon). The user can click on the icon to change the report's status. |
Author | Indicates the name of the user who has created the Status Report. | |
Submitted Date | Indicates the date on which the Status Report has been submitted. | |
Title | Indicates the title of the Status Report. If no title has been defined, the submitted date of the Status Report will be displayed instead. | |
Tag | Indicates the Status Report's Tag (if any). | |
Indicators | Shows the Indicators defined when submitting the report. |
In addition, clicking on the Select label in the bottom right corner of the card displays the corresponding Status Report information on the right-hand side of the view.
The following tools are available in the upper section of the panel:
Tag | Allows the user to only display the Status Reports whose Tag has been selected. Settings This filter is only available if some Tags have been defined by the Administrator in the System Data workspace, Status Reports tab, Tags sub-tab. |
New | Prompts the New Status Report popup, allowing the user to create a new Status Report either from the latest submitted report, or from blank. Once the popup closed, the view switches to the Status Report Creation view. |
View All | Opens the Status Report History full screen view, allowing the user to review all the previously submitted Status Report for the selected project. |
Upon selecting a Status Report in the Last Submitted panel, the corresponding information is displayed.
The header of the Submitted Status Report Details view provides the following information: Project Name and ID, Status Report Title, submission date, Author, and Indicators.

In addition, the upper right corner of the view provides the following commands:

The How is the project doing? section provides the following project information: Current Baseline, Start, Finish, Baseline Start, Baseline Finish, Total Effort, Actual Effort, Baseline Effort, Total Cost, Actual Cost, Baseline Cost, and Budgeted Cost.
When the Contract Type feature is enabled, the Total Effort, Actual Effort, Total Cost, and Actual Cost generated by External Resources will be displayed as well. These values will be identified by the External Resource icon ( ).
).
The captured Description sections are then displayed.
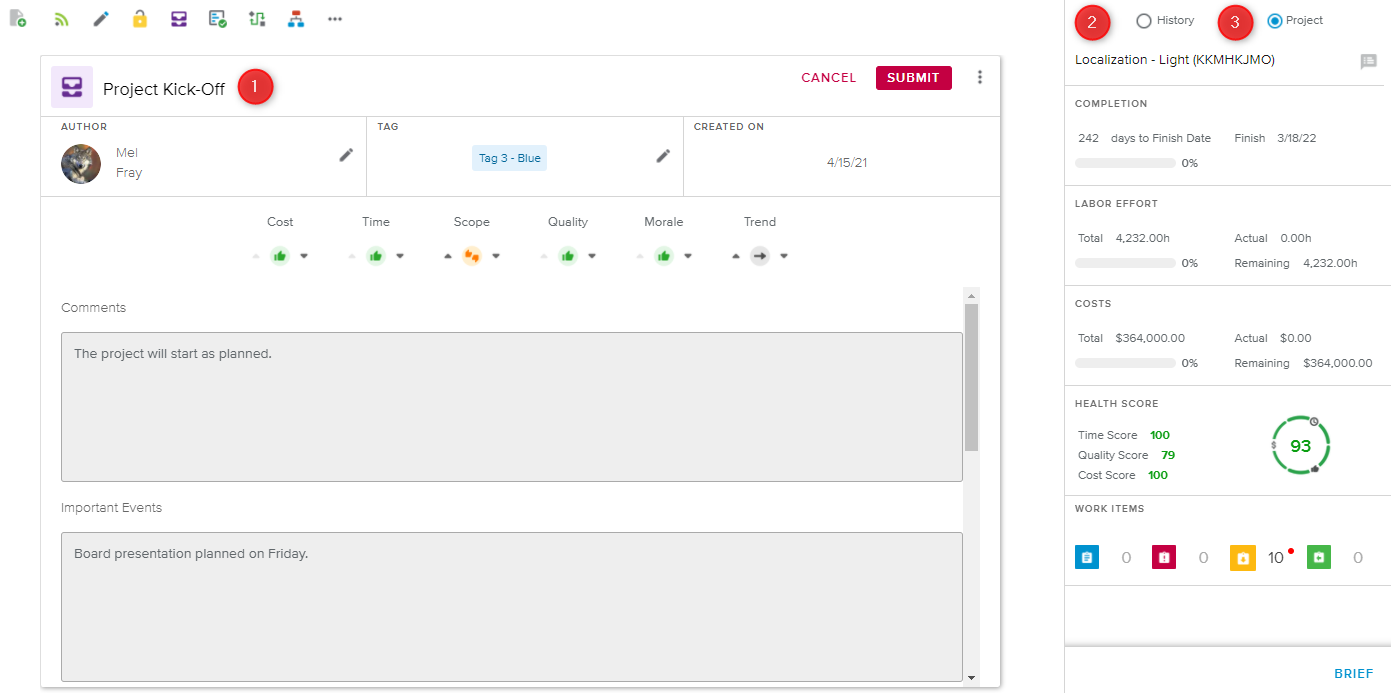
The Status Report Creation view is displayed as soon as the user starts creating a new Status Report. It is made up of:
The Status Report Information on the left-hand side, where the user can enter the desired indicators and descriptions before submitting his/her report
The History panel (located in the right panel), which provides the last three submitted reports for the user to review
The Project panel (located in the right panel), which provides all the project-related information that can be useful for the user to write his/her report.
This view allows the user to enter the main information regarding the Status Report.
The upper section provides the following information:
Title | Indicates the title of the Status Report. Clicking on the title prompts the Edit Attributes popup. |
Author | Indicates the name of the user who created the Status Report. Only the Author can edit the report once submitted. Clicking on the Edit ( |
Tag | Indicates if the Status Report has been tagged. Clicking on the Edit ( Settings Tags are defined by the Administrator in the System Data workspace, Status Reports tab, Tags sub-tab. |
Created On | Indicates the date on which the Status Report has been created. |

In addition, the following commands are available in the upper right corner:
Cancel | Takes the user back to the Last Submitted Report view. | |
Submit | Captures and stores all the entered values and takes the user back to the Last Submitted Report view. | |
 | More | Provides access to the following commands:
|
The user can then enter some Indicators. Indicators such as the Cost, the Time, the Scope, and the Trend are based on observations and feelings. They are subjective and are not derived from calculated indicators. The indicators inform the Project manager when to take action, and they are color-coded as follows:
 | Red | The Project Manager needs to investigate and take corrective actions immediately. |
 | Amber | The Project Manager needs to be prepared in case actions need to be taken. |
 | Green | The Project Manager has nothing to worry about. |
In order to modify the colors and values of the indicators, the user should click on the “Up” and “Down” arrows.
The Descriptions are Rich text sections that allow the user to enter any relevant information regarding the report. This information will then be available in the printable report as well.
By default, the following Description sections are provided for the Project Manager to enter information in his/her Status Report:
Comments | Explanations about the values of the colored indicators |
Important Events | The main achievements of the past reporting period |
To Be Discussed | Any items that the Project Manager would like to discuss more specifically with the team |
Next Steps | The main achievements expected for the upcoming reporting period |
Decisions | Any decision taken during the meeting |
Meeting Attendees | The list of the persons who were present at a meeting |
The Administrator can manage the Descriptions as follows:
Enable and rename sections in the System Settings workspace, Project Settings folder, Status Report Options tab, Descriptions sub-tab.
Add as many Descriptions as he/she desires in the System Data workspace, Status Reports tab, Additional Descriptions sub-tab.
The History panel located in the right-hand side of the view displays the last three submitted Status Reports for the selected project.
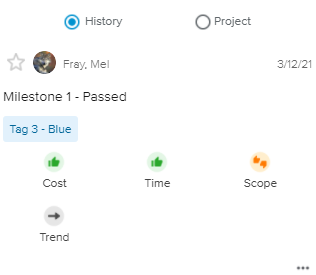
For each submitted report, the following information is displayed:
| Favorite | Indicates whether the Status Report is marked as "Favorite" (yellow icon) or not (grey icon). The user can click on the icon to change the report's status. |
Author | Indicates the name of the user who has created the Status Report. | |
Submitted Date | Indicates the date on which the Status Report has been submitted. | |
Title | Indicates the title of the Status Report. If no title has been defined, the submitted date of the Status Report will be displayed instead. | |
Tag | Indicates the Status Report's Tag (if any). | |
Indicators | Shows the Indicators defined when submitting the report. | |
 | Details | Opens the full report popup, allowing the user to review the whole Status Report (depending on the Status Report Preferences defined when the Status Report was submitted). |
Clicking on the View All button located in the footer opens the Status Report History full screen view.
The Project panel aims at providing all the information that can be useful for the user to write his/her report.
The Administrator can customize what information to display instead of the project's Name and ID by overwriting the following formula: [Project] Overwritable Displayed Project Name
Next to the project's Name, the Notes ( ) icon can be found, indicating whether or not there are new project notes or not. Clicking on the icon opens the Notes dialog box.
The following information is available:
Completion section | |
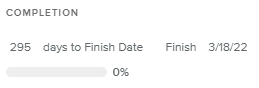 | The Completion section provides the following information: number of days before the Finish Date, Finish Date and, % Completed. |
Labor Effort section | |
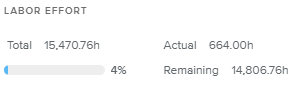 | This section provides the following information: Total Effort, Actual Effort, Actual Effort/Total Effort ratio, and Remaining Effort. |
Costs section | |
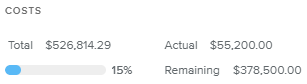 | This section provides the following information: Total Cost, Actual Cost, Actual Cost/Total Cost ratio, and Remaining Cost. |
Health Score section | |
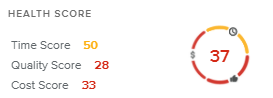 | The Health Score section provides the overall project Health Score as well as the detail of the Cost, Time, and Quality Scores. Upon clicking on the Health Score value, the Health Score Details popup is prompted. |
Agile section The content of the Agile section differs depending on the Iteration status: | |
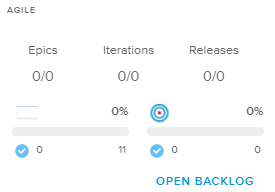 | If no Iteration has started, the following information will be displayed:
Clicking on the Open Backlog button will open the Full Backlog full screen view. |
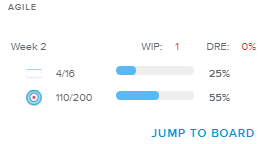 | If only one Iteration has started, the following information regarding the Iteration will be displayed:
Clicking on the Jump to Board button will open the Iteration full screen view, Board tab. |
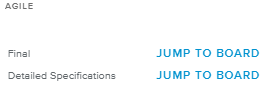 | If several Iterations have started, the list of on-going Iterations will be displayed. Clicking on the Jump to Board button for a given Iteration will open the corresponding Iteration full screen view, Board tab. |
Work Items section | |
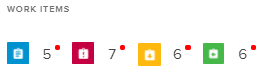 | For each Work Item category, the Work Items section provides the number of open Items. This number will be displayed with a red dot if at least one Work Item of the category features one of the following alerts: Overdue, Planned beyond Due Date, and Estimated in the Past. Clicking on a category will display the corresponding Work Items full screen view. |
Risks section | |
 | The Risks section indicates the number of open Risks. This number will be displayed with a red dot if at least one Risk features one or more alerts. Clicking on the Risk icon or number will display the Risks full screen view. |
Clicking on the Brief button located in the footer displays the Project Brief dialog box.