Once Team Members have submitted their Timesheets, Resource Managers can use the Resource Validation workspace, Timesheets tab, to either review the information submitted or send it back to be reworked.
Reviewing Timesheets is optional and they can be directly approved by the Project Manager without being reviewed by the Resource Manager.
The Resource Validation workspace, Timesheets tab, provides the Organizations Data Selector, which displays all the Organization branches for which the logged-in user is Manager 1, 2, or 3.
For further information on the use of the Data selector, please refer to the Library section of this topic.
The upper section of the Home Page provides all the necessary tools for the user to not only navigate in the views, but also to define the Timesheets displayed in the Home Page view.
The Time Frame selection pick-list allows the user to select a time frame for the Timesheets from among the following: “Current Week”, “Previous Week”, “Specific Week”, “Current Month”, “Previous Month”, “Specific Month”, and “Custom”.
For all the aforementioned options except “Custom”, the user has the ability to navigate between time frames by clicking on the Previous ( ) and Next (
 ) buttons.
Upon choosing the “Specific Week” or “Specific Month” options, the user will be prompted to choose a date; the resulting time frame will be the corresponding week or month containing the date selected.
Once a specific Time Frame is selected, the user can click on the Edit ( ) button to modify it.
Upon choosing the “Custom” option, the user will be prompted to choose a Start and Finish date for the desired time frame.
The time-distributed intervals displayed will be conditioned by the selected dates as follows:
When the Finish date is set up to 12 days after the Start date, the intervals displayed will be in days,
When the Finish date is set between 13 days and 12 weeks after the Start date, the intervals displayed will be in weeks,
When the Finish date is set between 13 weeks and 12 months after the Start date, the intervals will be displayed in months,
When the Finish date is set 13 months or more after the Start date, the intervals will be displayed in years.
Once a custom Time Frame is selected, the user can click on the Edit () button to modify it.
The Timesheets tab provides the following display options:
 | Sort By | Allows the user to sort the resources by Name or Organization. |
 | Charts | Allows the user to display the Key Facts & Charts section. |
 | Show Reviewed & Approved | Allows the user to display Timesheets whose Status is "Reviewed" or "Approved". |
| Show Inactive | Allows the user to display or hide Inactive Resources (Resources are not available for any assignment). |
 | Search | Allows the user to search the Resources by Name. |
The Timesheets Overview provides the list of Resource Timesheets, grouped by overall Status.
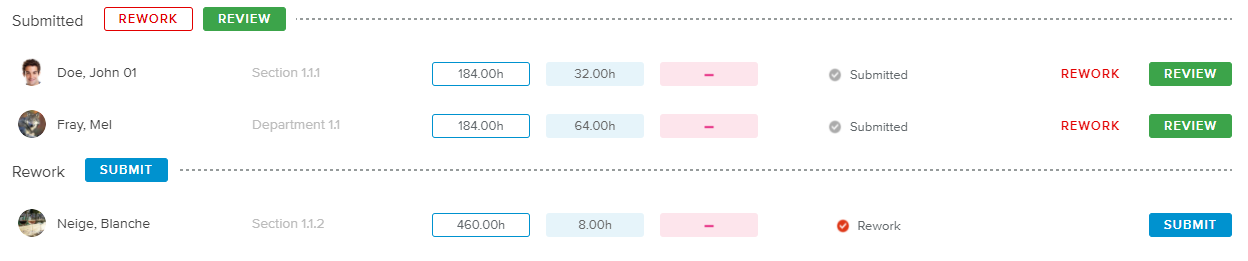 |
Clicking on the Resource’s name opens the corresponding Timesheet Details full screen view.
Depending on the Timesheets Status, the following commands will be available to perform bulk or individual actions:
Submit | Allows the Resource Manager to submit actuals instead of the Team Member. Submit is only available if the Status of the Timesheet is Working. |
Review | Allows the Resource Manager to accept the Actual Effort values submitted for a task. Review is only available if the Status of the Timesheet is Submitted. |
Rework | Allows the Resource Manager to send back the submitted data to the appropriate Team Member for modification. Rework is only available if the Status of the Timesheet is Submitted, Reviewed, or Approved. |
For further information on the use of the commands, please refer to the Library section of this topic.
When the Charts () display option is activated, the following chart and key facts are displayed in the upper section of the Home Page.
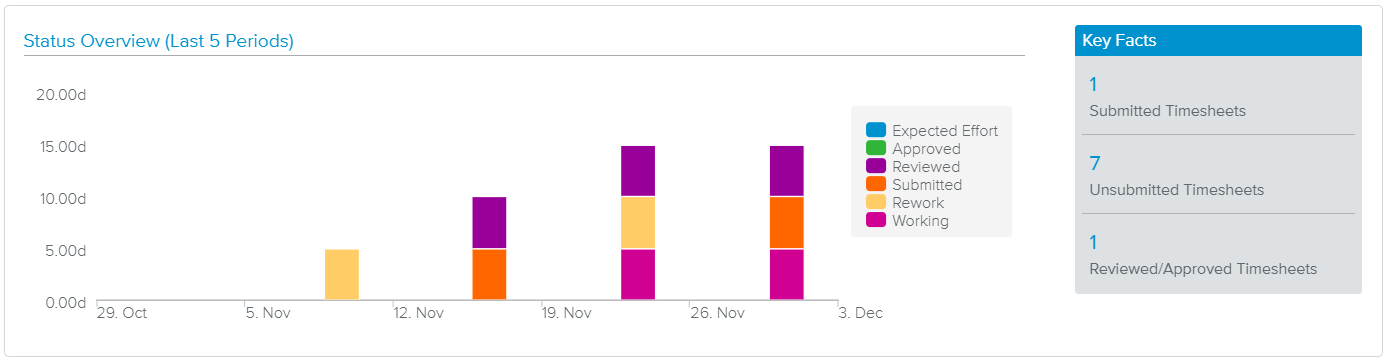 |
For the organizations and time period selected, the Status Overview graph compares the Expected Effort with the Actual Effort broken down by Status for the current interval as well as for the previous four intervals. The Status values can be Working, Submitted, Reviewed, Approved, or Rework.
On the right-hand side, the user can access the Key Facts, wherein he/she can view the number of Submitted Timesheets, Unsubmitted Timesheets, and Reviewed/Approved Timesheets within the period selected and for the organizations selected.