The Compare Projects dialog box is displayed upon clicking on the Review Scenario Projects ( ) button, available in the Scenarios List spreadsheet.
It aims at helping the user identify the differences between the original project version (current state) and the Scenario version (copied upon creating a Scenario).
When the Charts ( ) display option is activated, the following chart and key facts are displayed in the upper section of the dialog box.
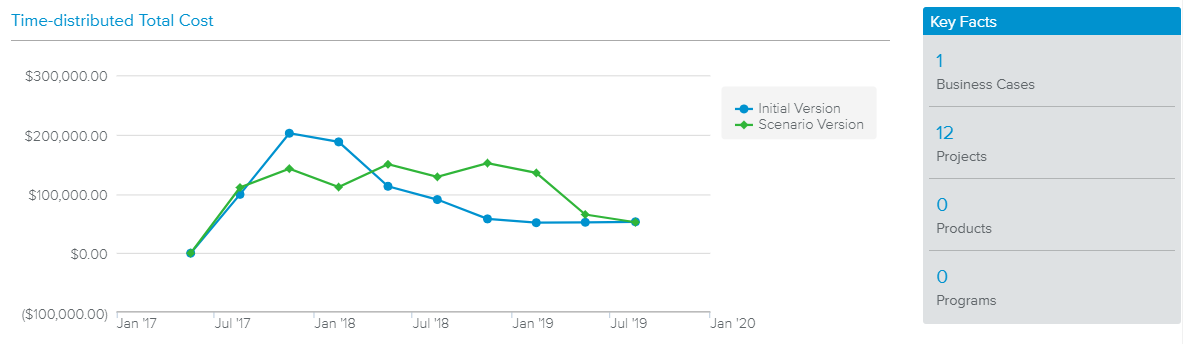
The chart compares the time-distributed Total Cost between the Scenario and Initial versions of the projects included in the selected Scenario.
The Key Facts section indicates the number of projects for each project Nature.
The Compare Projects spreadsheet provides the list of projects belonging to the selected scenario, sorted by Portfolio Folder and project Nature.
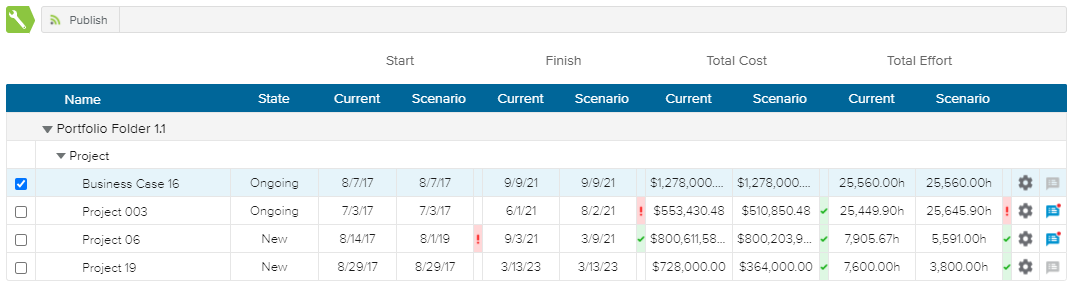
The following attributes are available for the user to compare the original project and the scenario version: Workflow State Vote, Start date, Finish date, Total Cost, and Total Effort.
This assessment helps in understanding the changes that will need to be made to the official versions of the Projects to “apply” the decisions made within the Scenario.
If the user is Manager 1, 2, or 3 of the project, he/she will be able to edit the State field.
The spreadsheet provides the following tools:
 | Publish | Allows the user to Publish the selected project(s). This command is only available in the spreadsheet toolbar when at least one project is selected (i.e., the corresponding checkbox is ticked). |
 | Gear | Provides access to the following commands:
|
 | Notes | Indicates whether or not there is a new note, and opens the Notes dialog box. |
In addition, the following colored indicators are provided:
 | Red | Indicates that the date, cost, or effort value of the Scenario project is after/higher than the original project's value. |
 | Green | Indicates that the date, cost, or effort value of the Scenario project is before/below the original project's value. |
Changes made to projects will affect their current Working versions. Projects must then be published to propagate the changes.