The Phases & Gates has been specifically designed for users who want to use the Phase/Gate methodology for product development.
The following view modes are available:
 | Overview | Allows the user to quickly review the status of his/her product. |
 | Phases/Gates | Allows the user to indicate which tasks are Phases and which Milestones are Gates and to manage them all. |
 | Deliverables | Allows the user to manage the Deliverables. |
The Overview mode () provides various charts and a Key Facts section that allow the user to quickly review the status of his/her product.
The Key Facts section displays the following information: Number of Gates, Number of Gates on Time, Number of Gates Late, and OTD in %.
A Gate is considered as “Late” or “On Time” depending on its OTD Status.
The Overview mode provides the following charts:
Gates by OTD Status pie chart – Allows the user to review the number of gates by OTD status.
Deliverables by State pie chart – Allows the user to review the number of Deliverables per Workflow State.
Roadmap chart – Allows the user to review the Phases & Gates flowchart.
The Roadmap chart is only displayed in single-project selection.
The user can take advantage of the “Phases & Gates Flowchart dates” option to either display the current or the OTD Baseline dates in the chart.
The Roadmap spreadsheet is only displayed when multiple projects are selected in the data selector.
For each project, the following attributes are provided: Portfolio Folder, Name, Current Phase, Next Gate, OTD %, Manager 1, Workflow State Vote, and Finish.
The % OTD values are displayed in different colors to highlight the difference between Gates that are on time and the total number of Gates. The user can access the legend of the colored indicators by clicking on the Legend ( ) button located in the bottom right corner of the view.
Colored Indicators are defined by the Administrator in the System Settings workspace, General Settings folder, Colored Indicators tab, Phases & Gates Preferences.
In addition, the following tools are provided:
 | Notes | Indicates whether or not there are new notes, and opens the Notes dialog box. |
 | Details | Opens the Gate Status Reports full screen view, with the Next Gate made current. |
The Phases/Gates mode () provides a spreadsheet displaying all the relevant information to keep track of the phases and the gates of the selected project(s). In multi-project selection, the projects are sorted by Portfolio Folders.
The Filters popup provides the following filtering fields:
Show All Tasks | Allows the user to display all the project's Tasks (rather than only tasks whose Workflow is "Phase" or "Gate". |
Workflow State | Allows the user to only display the Phases and/or Gates whose Workflow State Vote has been selected. |
OTD Status | Allows the user to only display Phases and Gates whose OTD Status has been selected (“Completed and on time”, “Completed and late”, “Not completed and on time”, and “Not completed and late”). |
Upon activating the Charts ( ) display option, the Charts section is displayed in the upper part of the view.
Charts are only available in single-project selection.
By default, the Phases & Gates spreadsheet displays the project's tasks that have been identified as a Phase or a Gate.
The user can take advantage of the "Show All Tasks" option available in the Filters popup to display all the project Tasks regardless of whether or not they are defined as a Phase or Gate.
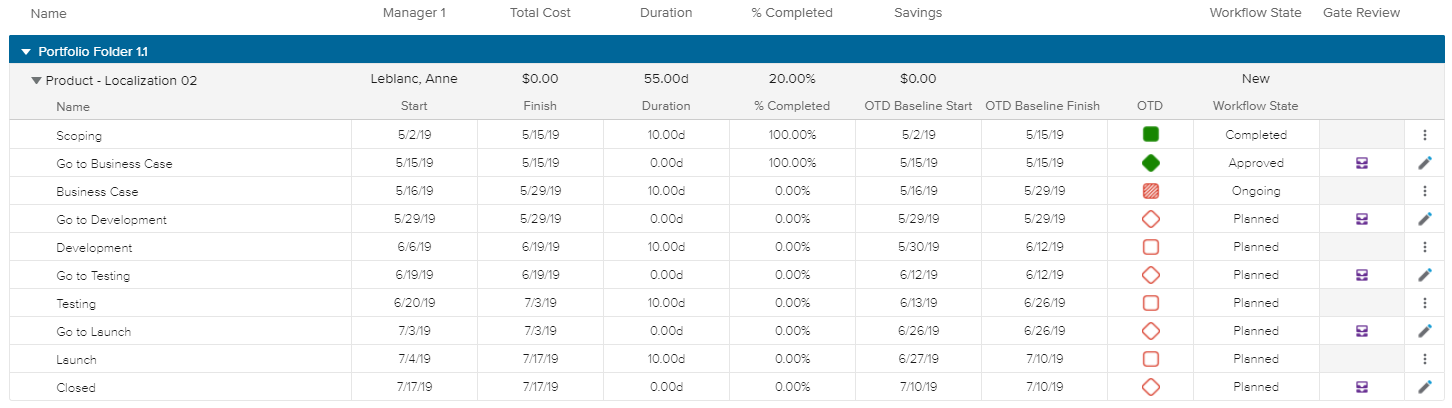
The following project attributes are displayed: Name, Manager 1, Total Cost, Duration, % Completed, Savings, and Workflow State.
For each Phase and Gate, the following attributes are displayed: Start, Finish, Duration, % Completed, OTD Baseline Start, OTD Baseline Finish, OTD, and Workflow State.
The following tools are available to manage Phases & Gates:
 | Gate Review | Opens the Gate Status Reports full screen view. |
 | Edit | Opens the Task Details dialog box. |
 | More | Provides access to the following commands for a given Phase:
|
For Tasks that have not been identified as a Phase or a Gate, the More () button provides both the "Turn Task into Phase" and "Turn Task into Gate" options, allowing the user to plan his/her Phases & Gates.
If the user needs to turn a Phase or a Gate back into a regular Task, the corresponding command is available in the Task Details dialog box, upon clicking on the More () button displayed in the upper right corner.
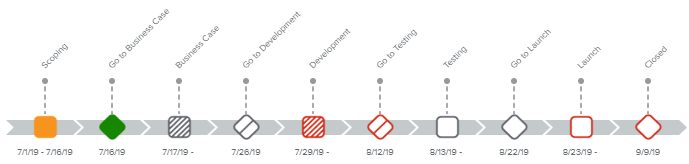
When the Charts () display option is activated, the Phases & Gates flowchart is displayed, offering a workflow of the phases and gates.
The following legend describes the symbols used in this flowchart:
Object | Symbol | Description |
|---|---|---|
Phase |  | Square that is empty; used when the phase is planned. |
 | Square that is hashed; used when the phase is ongoing. | |
 | Square that is solid; used when the phase is completed. | |
Gate |  | Diamond that is empty; used when the gate is planned. |
 | Diamond that is solid; used when the gate is approved. |
The user can access the legend of the flowchart by clicking on the Legend () button located in the bottom right corner of the view.
Please refer to the Phases & Gates Flowchart legend article for more information regarding the flowchart symbols and colors.
The Deliverables mode () provides a view for managing all the relevant deliverables associated with the selected project(s).
The Filters ( ) popup provides the following filtering fields:
Assignee | Allows the user to only display Deliverables whose Assignee has been selected. |
Due Date Before | Allows the user to only display work items with a Due Date the same as or before the entered date. |
Priority Level Under | Allows the user to only display deliverables with a priority equal to or less than the entered value. (The lower the number, the higher the priority.) |
Deliverable Workflow State | Allows the user to only display deliverables whose Workflow State has been selected from the pick-list. |
Deliverable Related Gate | Allows the user to only display deliverables whose Related Gate has been selected. |
Deliverable Types | Allows the user to only display deliverables whose Type has been selected. |
Show Only Task Deliverables | Upon activating this switch button, only the deliverables whose Parent is a Task will be displayed. |
Show Only Contract Deliverables | Upon activating this switch button, only the deliverables that have been defined in a Contract will be displayed. |
Show Only Flagged Deliverables | Upon activating this switch button, only the deliverables that have been flagged will be displayed. |
Show Only Related to Gate Deliverables | Upon activating this switch button, only the deliverables for which a Related Gate has been defined will be displayed. |
Show Only Mandatory Deliverables | Upon activating this switch button, only the deliverables that have been marked as Mandatory will be displayed. |
In addition to the filtering fields available in the Filters popup, the following display options are provided:
 | Group By | Allows the user to choose whether to sort the displayed Deliverables by Projects and Tasks, by Related Gate, or by Type. |
| Charts | Displays the Charts section above the spreadsheet. |
The Deliverables spreadsheet lists all the Deliverables attached to the selected project(s) (or the selected project(s) tasks).
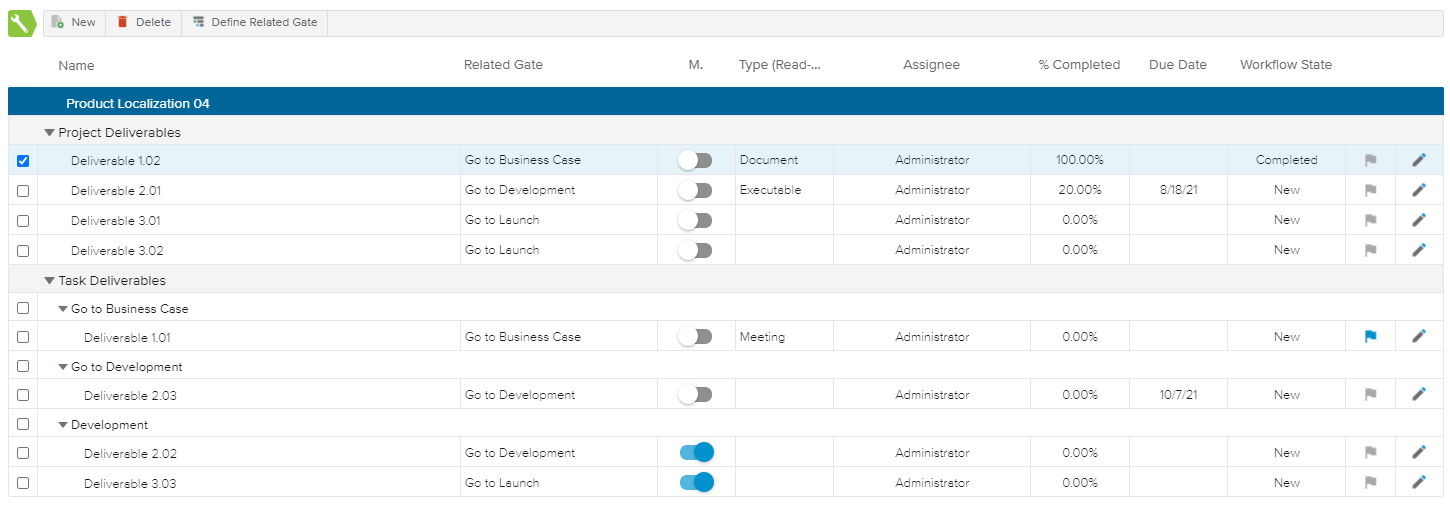
The Deliverables spreadsheet provides the following attributes: Name, Related Gate, M. (for Mandatory), Type (read-only), Assignee, % Completed, Due Date, and Workflow State.
The spreadsheet provides the following tools to manage the deliverables:
 | New | Opens the Deliverable dialog box so that the user can create a new Deliverable. |
 | Delete | Allows the user to delete the selected Deliverable(s). This command is only available if at least one Deliverable is selected (i.e., the corresponding checkbox is ticked). |
 | Define Related Gate | Allows the user to select a Related Gate for the selected deliverable(s). This command is only available when at least one Deliverable is selected (i.e., the corresponding checkbox is ticked). |
 | Reset from Template | Allows the user to recreate all the Deliverables attached to a specific Task by importing the Deliverables attached to a Template Task. This command is only available when selecting a Task (i.e., the corresponding checkbox is ticked). |
 | Flag | Allows the user to mark the Deliverable as flagged. |
| Edit | Opens the Deliverable dialog box so that the user can view and edit all the information for the Deliverable. |
The New and Delete commands are only available if the Administrator has activated the "Enable Deliverable Creation", and "Enable Deliverable Deletion" options in the System Settings workspace, Project Settings folder, Display Preferences tab.
When the Charts () display option is activated, a chart is displayed, showing the number of “Completed”, “Ongoing”, and “Pending” deliverables (related to the Deliverable workflow).
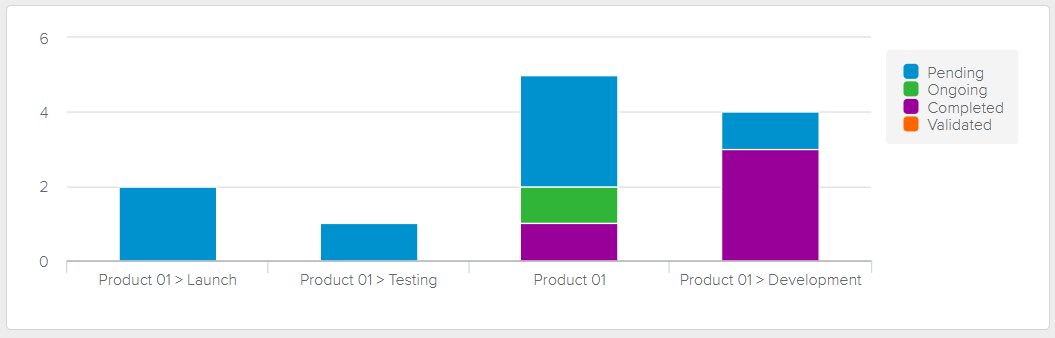
The Deliverables are sorted either by Project/Task, by Related Gate, or by Deliverable Type depending on the selected Group By display option.