When clicking on the interactive Gear button ( ) for a Gantt chart, the following Export dialog box is displayed, allowing the user to select from the Gantt Printing Options accessible to him/her in Sciforma.
Please note that when printing a Gantt chart:
All the displayed columns will print out. The user can, however, take advantage of the spreadsheet customization options to add and remove columns.
The printed version of the Gantt chart contains the same collapsed and expanded tasks found in the HTML5 Client Gantt chart.
When some filters are activated in the Gantt Filters dialog box, the printed version will also comply with these filtering options.
Previously selected print settings are not saved by Sciforma. The user will need to choose new print options each time he/she accesses the Export dialog box.
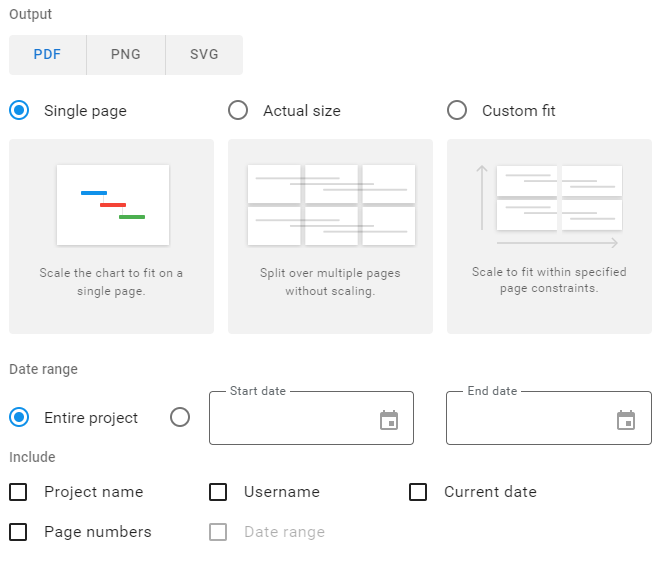
The following formats are available for selection:
Use this format to output the Gantt chart as a ready-to-print single page or, alternatively, to break down the chart into multiple printable pieces that can be put together on a board or wall. Additional information can be added to headers or footers. | |
PNG | Use this format to export Gantt charts as an image to be inserted in slides or documents, for instance. Note: A PNG export is limited to fifty tasks. |
SVG | Use this format to export a Gantt chart as an image that can be resized without losing its resolution. In using the SVG file format, charts can be easily displayed in a website, for instance. |
The following outputs are available for selection:
Simple page | The Gantt chart fits in a one-page document. |
Actual size (for PDF output only) | The Gantt chart is printed on several pages that can then be put together (assembled side-by-side on a board, for instance). |
Custom fit (for PDF output only) | The Gantt chart is printed on a number of pages defined by the user. 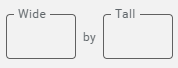 |
The “Wide” and “Tall” input boxes can only contain integers from 1 to 99, otherwise, the “Export” button will remain unclickable. If the integers specified exceed the 100% scale of the Gantt chart, then only pages corresponding to the scale of the Gantt will be printed.
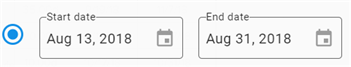
Two options are available for the date range:
Entire project – The Gantt chart for the entire duration of the project will be printed.
Custom range – Allows the user to print only the section of the Gantt chart defined by the start and end dates that he/she specifies.
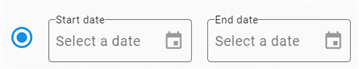
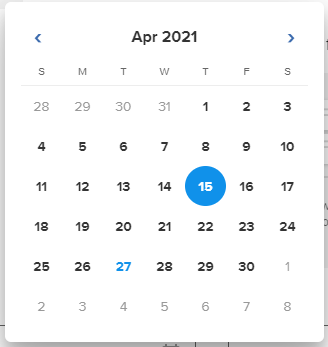
Upon clicking in the Start Date or End Date field, a calendar is displayed from which the user can select the date.
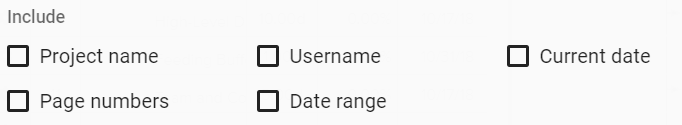
When choosing the PDF format, the user can select from the following options:
Project Name | The project name is displayed in the upper left-hand corner. |
User Name | The user name is displayed at the bottom (middle of the page). |
Current Date | The current date is displayed in the bottom left-hand corner. |
Page Numbers | Page numbers are displayed in the bottom right-hand corner. |
Date Range | The date range is displayed (only available if a custom date range has been selected). |