Take a tour of all workspaces and views related to this topic.
The following display options are available in the top of the view:
 | Filters | Opens the Filters popup. |
 | Sort By | Allows the user to sort the spreadsheet data by Priority, Deadline, Score, or Alphabetical order. Additionally, the KPI mode provides the following additional sorting options: Total Cost (ascending), Savings (descending), ROI (descending), NPV (descending), and Payback (ascending). |
 | Charts | Allows the user to display the Charts section in both modes. |
 | Search | Allows the user to look for a Business Case Name. |
In addition, the view mode selection buttons are also provided:
 | Budget | Compares the potential projects with each other in order to identify the most interesting ones. |
 | KPI | Focuses on the KPI to help the Portfolio Manager in the decision-making process. |
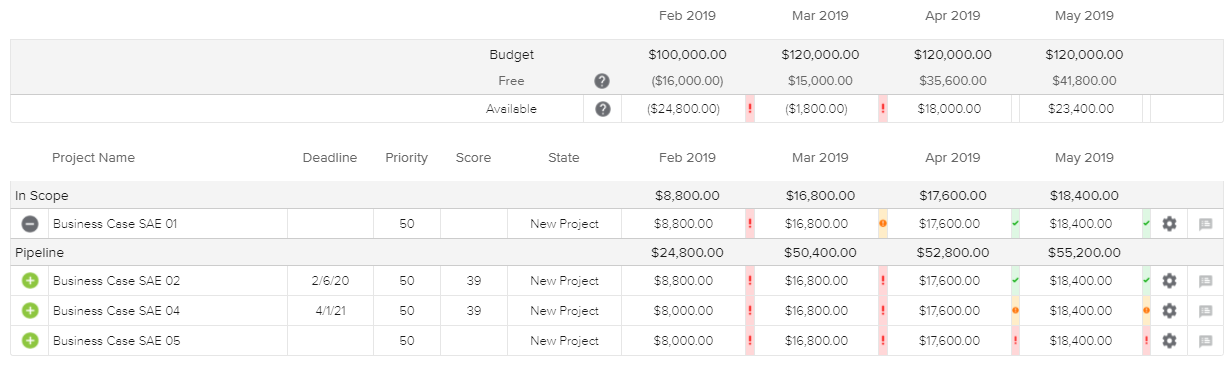
The Budget mode () provides a spreadsheet that displays all the projects eligible (in the In Scope and Pipeline sections) for the Ranking phase.
By default, all the views of this workspace only consider projects whose Nature is “Business Case”. For other projects to be taken into account, the Administrator will need to overwrite the “Portfolio Ranking Filter” Project formula.
For the selected Portfolio Folder(s), the Budget mode helps in comparing the potential projects with each other in order to identify the most interesting ones.
The header of the spreadsheet displays the following time distributed budget values:
The Portfolio Budget is the budget associated to Cost Centers that have been entered in the Portfolio Center workspace, Budget tab, Portfolio Budget mode.
The Free Budget is equal to the Portfolio Budget minus the Budget allocated to Projects (that is to say the budget of the ongoing projects belonging to the selected Portfolio folder).
The Available Budget is equal to the Portfolio Budget minus the Budget allocated to Projects minus the Total Cost of “In Scope” Business Cases.
The Portfolio Free Budget Source is defined by the Administrator in the System Settings workspace, Budget/Finance Settings folder. It can be adjusted based on either the Project Budget or on the Project Cost.
The spreadsheet provides the following tools:
 | Add | Allows the user to move the Business Case to the “In Scope” section. Adding projects will decrease the Available Budget. |
 | Remove | Allows the user to move the Business Case back to the “Pipeline” section. |
 | Gear | Provides access to the following commands:
|
 | Notes | Indicates whether or not there are new notes, and opens the Notes dialog box. |
The spreadsheet displays for each business case the following attributes:
Project Name | Indicates the name of the Business Case. |
Deadline | Indicates the date before which the project must be completed. The Deadline value can be updated directly in the spreadsheet if the user has the relevant project Permissions. |
Priority | Indicates the Business Case Leveling Priority The Priority value can be updated directly in the spreadsheet if the user has the relevant project Permissions. |
Score | Indicates the Score of the Business Case as follows:
|
State | Indicates the current Workflow State of the Business Case. The Workflow State can be updated directly in the spreadsheet if the user has the relevant project Permissions. |
Then the spreadsheet displays the Business Cases time-distributed Total Cost or Forecast Cost (depending on the Business Case Ranking Cost Source).
A colored indicator can appear on the right-hand side of the distributed Total Cost/Forecast Cost:
 | Red | The Total Cost/Forecast Cost is completely out of budget for that specific period. |
 | Amber | The Total Cost/Forecast Cost is partially out of budget for that specific period. |
 | Green | The Total Cost/Forecast Cost fits completely in the budget for that specific period. |
At the bottom of the view, the Add Work Item button enables users to create a new Issue, a new Action, a new Change Request, or a new Deliverable.
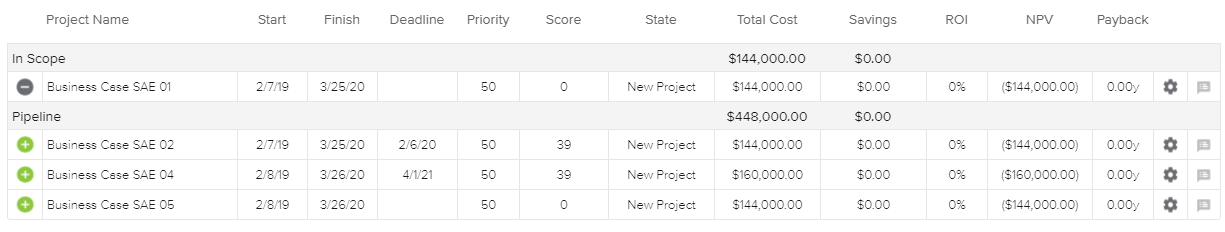
The KPI mode () provides a spreadsheet that displays all the projects eligible (in the In Scope and Pipeline sections) for the Ranking phase.
By default, all the views of this workspace only consider projects whose Nature is “Business Case”. For other projects to be taken into account, the Administrator will need to overwrite the “Portfolio Ranking Filter” Project formula.
This mode will focus on the KPI to help the Portfolio Manager in the decision-making process. That is why it gives the same kind of tools as in the Budget mode, but the table focuses on the KPIs.
The following project attributes are displayed: Start, Finish, Deadline, Priority, Score, State, Total Cost, Savings, ROI, NPV, and Payback.
It is possible to update directly in the spreadsheet, the Priority, the Deadline, and the workflow state if the user has the project permissions.
The spreadsheet provides the following tools:
| Gear | Provides access to the following commands:
|
| Notes | Indicates whether or not there are new notes, and opens the Notes dialog box. |
At the bottom of the view, the Add Work Item button enables users to create a new Issue, a new Action, a new Change Request, or a new Deliverable.
The Charts section, available when the Charts ( ) display option is activated, provides a series of charts. The user can select the charts to display by clicking on the folders available on the left-hand side of the section:
KPI Overview
TOP 5 - Project Costs
TOP 5 - Project Strategy
For the selected portfolio folder, the KPI Overview chart helps users in comparing the potential projects with each other in order to identify the most interesting ones. Only projects with Payback greater than zero will be displayed.
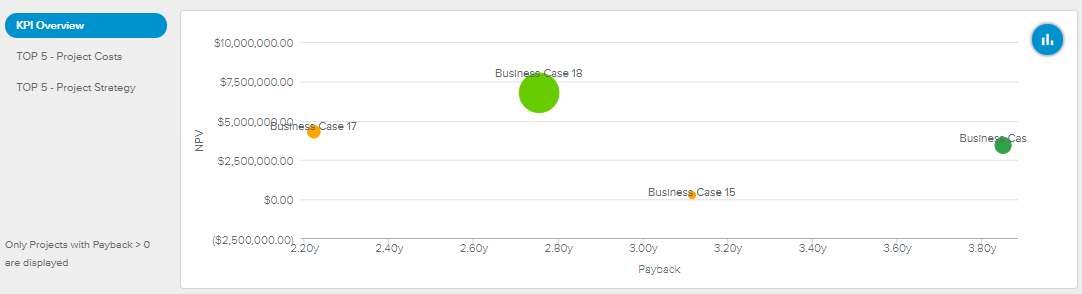
The legend is as follows:
X-axis: Payback
Y-axis: NPV
Size: Total Cost
Color: Total Score
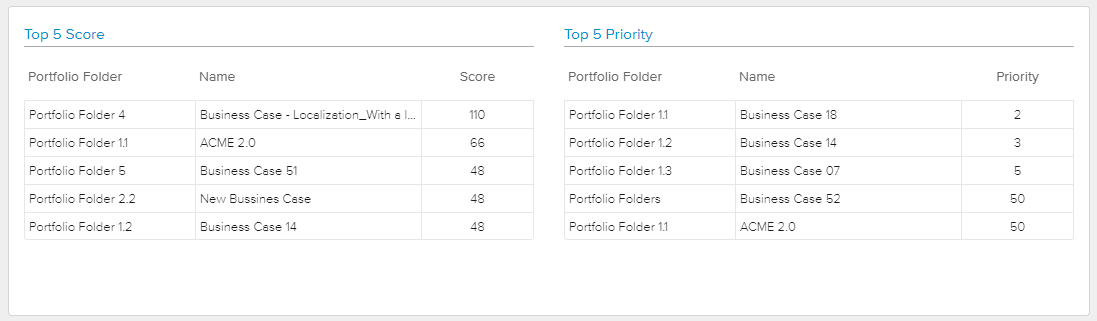
The TOP 5 - Project Costs spreadsheets will show the top five projects in the following categories: NPV (the higher, the better), ROI (the higher, the better).