Take a tour of all workspaces and views related to this topic.
The Portfolio Simulation workspace aims at providing all the tools the Portfolio Manager needs to determine which of the new potential projects (from the Portfolio Ranking step) can actually be launched and when (and in accordance with parameters the Portfolio Managers can fully control: portfolio-level cash flow, cost budget, or effort budget).
Before playing a scenario, the Portfolio Simulation workspace's main toolbar, located on the top of the view, features the following tools:
 | Capture | Allows the user to create a new scenario in the Scenario Definition dialog box. |
 | Manage | Allows the user to review existing scenarios and delete them in the Manage Scenarios dialog box. |
Scenario Workflow State | Allows the user to only display the Scenarios whose Workflow State has been selected. This option applies to both the spreadsheet and the charts section. | |
 | Charts | Upon activating this display option, the Charts section is displayed above the spreadsheet. |
The view displayed before playing a scenario provides a spreadsheet listing for each selected Portfolio Folder the scenarios in which they are featured.

The following attributes are displayed:
Portfolio Folder | Indicates the name of the selected Portfolio Folder (or combination of several Portfolio Folders). |
Name | Indicates the name of the scenario in which the Portfolio Folder(s) are featured. |
Workflow State | Indicates the Workflow State of the scenario. |
Project # | Indicates the number of projects contained in the scenario Portfolio Folders. |
Cash Flow Current Year | Indicates the Cash Flow for the current year. |
Cash Flow Year +1 | Indicates the Cash Flow for the year after the current year. |
Cash Flow Year +2 | Indicates the Cash Flow for the year after the next year. |
The Portfolio Simulation workflow is defined by the Administrator in the Designer.
By default, the states of a Scenario can be: Draft, Completed, or Canceled.
Additionally, the following tools are available for each row of the spreadsheet:
 | Delete | Deletes the corresponding scenario. |
 | Review Scenario Projects | Opens the Compare Projects dialog box, allows the user to compare the project scenario version with the current version. |
 | Play Scenario | Plays the current scenario and switches the view to the After Playing a Scenario view. |
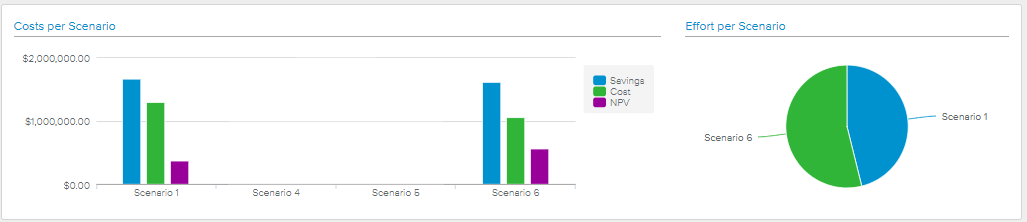
When the Charts () display option is activated, the following charts will be displayed:
Cost per Scenario – Displays, for each existing Scenario, the sum of Savings (i.e., Revenues), the sum of Total Costs, and the sum of NPV of the In Scenario Projects.
Effort per Scenario – Displays the breakdown of Total Effort coming from the Projects (In Scenario) for each of the Scenarios.
When several Scenarios have been defined, it is important to be able to compare them to identify which combination of Projects would generate the most interesting mix.
The main toolbar provides the following options:
Back to Scenario List | Allows the user to go back to the view before the scenario was played. | |
Current Scenario | Indicates the name of the currently displayed scenario. Upon clicking on it, the read-only Scenario popup provides the following information regarding the scenario: Description, Start Date, Initiator, Included Natures, Included Workflow States. | |
 | Filters | Opens the Filters popup. |
Hide Projects Outside Scenario | Allows the user to only display projects belonging to the current scenario. | |
| Charts | Displays the Charts section (for the Simulation mode only). Note The content of the Charts section is identical to the Analytics mode, Charts sub-tab. |
In addition, the view mode selection section allows the user to navigate between the following modes:
 | Simulation | Provides a Gantt chart allowing the user to easily visualize the Scenario. |
 | Analytics | Allows the user to further assess the current scenario in terms of Workload and Budget. |
The Simulation mode () provides a Gantt chart allowing the user to easily visualize their Scenario.
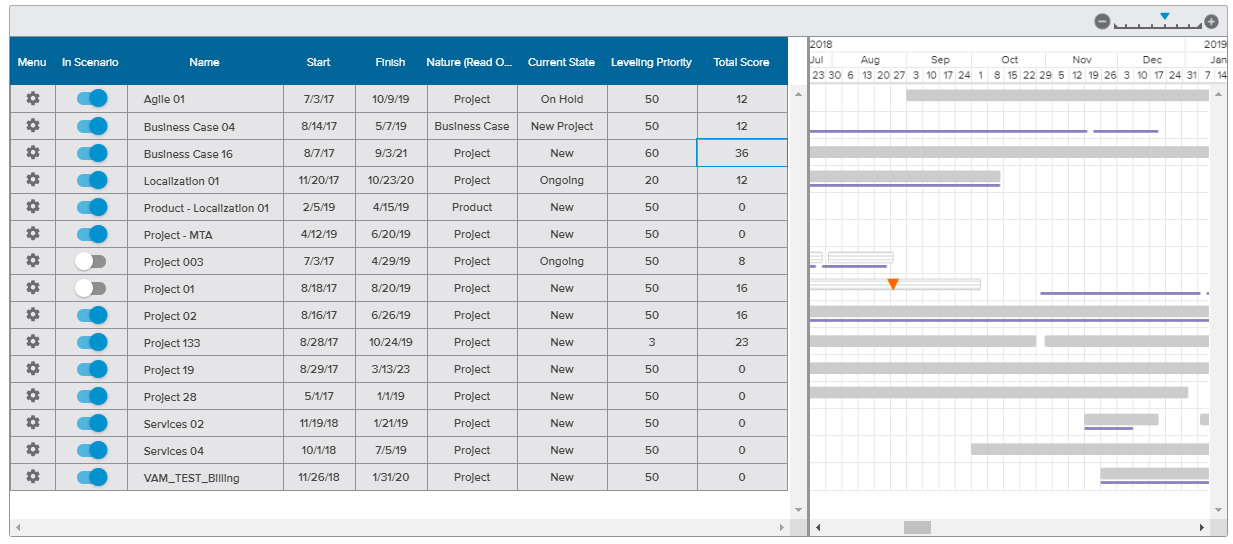
While all the Projects of the selected Portfolio Folder(s) (according to the selected versions and built-in filter) are added by default to the new Scenario, the Portfolio Manager has the ability to easily hide a Project from the Scenario.
Upon turning off the In Scenario switch button of a Scenario Project, it will be “removed” from the Scenario in the Gantt chart, and the three graphs will then ignore that Project as well.
The Project outside the current Scenario will remain visible in the Gantt view, so it can be put back into it but these Projects can also be hidden by enabling the option Hide Projects Outside Scenarios.
The spreadsheet provides the following project information: Name, Start, Finish, Nature (read-only), Current State, Leveling Priority, and Total Score.
The Gear ( ) icon provides the following commands:
Open Object Brief – Opens the corresponding Project Brief dialog box.
Edit the Object – Opens the project Focus Mode full screen view.
In the graphic pane of the Gantt chart, Projects, Products, and Programs can easily be moved in the Gantt view by dragging and dropping their corresponding bars.
Business Cases will be displayed in the same way as the other projects, except if the Ranking Cost Source is set to “Forecast Cost”; in that specific case, they are represented by blue lines, which cannot be moved (otherwise, it would move the Forecast Cost as well).
The legend is as follows:
Information | Corresponding Display |
|---|---|
In Scenario Project |  |
Outside Scenario Project |  |
Business Case with Ranking Cost Source set to "Forecast Cost" |  |
Baseline (Current Baseline) |
|
Project Deadline |  |
Today's Date |
|


The Analytics mode () allows the user to further assess the current scenario in terms of workload and budget.
The Budget in terms of Cost or Effort has to be set by the Administrator in the System Settings workspace, Budget/Finance Settings folder.
The Workload sub-tab provides a spreadsheet displaying the time-distributed Total Effort and Availability for the selected Portfolio Folder(s).
The user can take advantage of the following options available above the spreadsheet:
Organizations | Allows the user to only display data regarding the selected Organization(s). |
Job Classifications | Allows the user to only display data regarding the selected Job Classification(s). |
Skills | Allows the user to only display data regarding the selected Skills. |
Contract Type | Allows the user to select whether to only display Internal Resources, External Resources, or both. |
In addition, the Group By ( ) display option is available in the upper right corner of the view and allows the user to group the spreadsheet information by Organization, Job Classification, Resource, or Contract Type.
Colored indicators are provided to highlight the % shift between the Total Effort and Available Effort. The user can access the legend of the colored indicators by clicking on the Legend ( ) button located in the bottom right corner of the view.
Colored Indicators are defined by the Administrator in the System Settings workspace, General Settings folder, Colored Indicators tab, Resource Utilization Preferences.
The Budget sub-tab provides a spreadsheet comparing the time-distributed Portfolio Folders Budget and the Project Total Costs.
The spreadsheet displays the following colored indicators:
 | Red | The Projects Cost is greater than the selected Portfolio Folder(s) Budget. |
 | Green | The Projects Cost is less than the selected Portfolio Folder(s) Budget. |
In addition, upon activating the Cost Centers ( ) display option located in the upper right corner, the view data is broken down by Cost Centers, and the following additional options are available:
Cost Centers filtering field | Allows the user to only display data regarding the selected Cost Center(s). |
Effort Display | Allows the user to display the Effort values as entered by the user (“As Defined”) or as Monetized Amount (“As Costs”). Note This option is only available when in Mixed Budget Type (i.e., using both Cost and Effort Cost Centers). |
The Charts sub-tab provides a series of charts that the user can select on the left-hand side of the view.
This view would only make sense if resources are fully allocated to the selected Portfolio Folder(s) since effort spent in Portfolio folders other than in the selected one(s) will not be considered.
The Capacity Forecast values come from the Organization Center workspace, Capacity Forecasts tab.
The user can take advantage of the following options to adjust the chart display:
Organizations | Allows the user to only display data regarding the selected Organization(s). |
Job Classifications | Allows the user to only display data regarding the selected Job Classification(s). |
Skills | Allows the user to only display data regarding the selected Skills. |
Resources | Allows the user to only display data regarding the selected Resource(s). |
Contract Type | Allows the user to select whether to only display Internal Resources, External Resources, or both. |
In addition, the Group By () display option is available, allowing the user to group the Total Effort values by Project, Portfolio, Nature, Type, Assignment, or Contract Type.
This view provides graphical comparison of the Portfolio global Cost budgets (or Effort budgets) and the Total Cost (or Total Effort) of the Scenario Projects.
This view can be filtered by Cost Centers.
This view provides the yearly cash flow for Scenario Projects from the beginning of the current year up to the latest non-zero revenues year.