The Overview workspace allows the user to see at a glance whether he/she has some actions to do regarding his/her assignments, calendar requests, or Timesheets.
The Assignments spreadsheet provides the list of assignments and the corresponding effort for the logged-in user. The effort is displayed starting from the current date for three months.
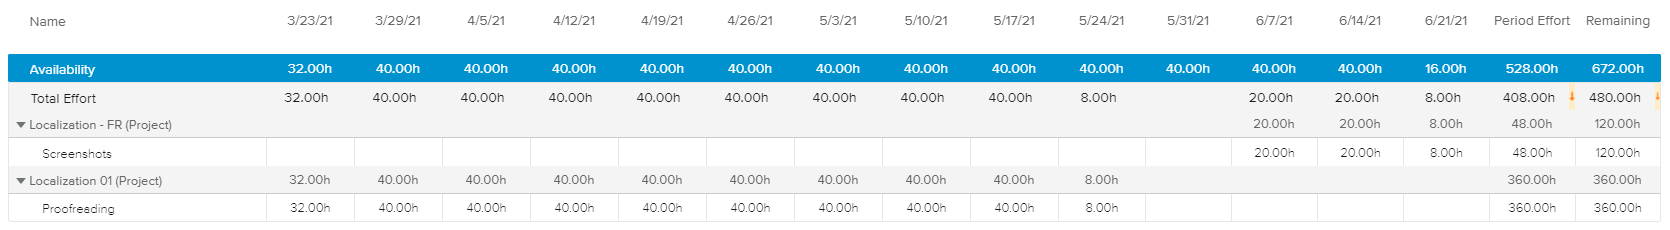
The spreadsheet also provides colored indicators to highlight the % shift between the user’s Total Effort and the Available Effort. The user can access the colored indicators legend by clicking on the Legend ( ) button located above the spreadsheet.
Colored Indicators are defined by the Administrator in the System Settings workspace, General Settings folder, Colored Indicators tab, Resource Utilization Preferences.
The Allocations spreadsheet displays the upcoming Resource Allocations for the next three months with the corresponding Allocated Effort.
The spreadsheet also provides colored indicators to highlight the % shift between the user’s Allocated Effort and the Available Effort. The user can access the colored indicators legend by clicking on the Legend () button located above the spreadsheet.
Colored Indicators are defined by the Administrator in the System Settings workspace, General Settings folder, Colored Indicators tab, Resource Utilization Preferences.
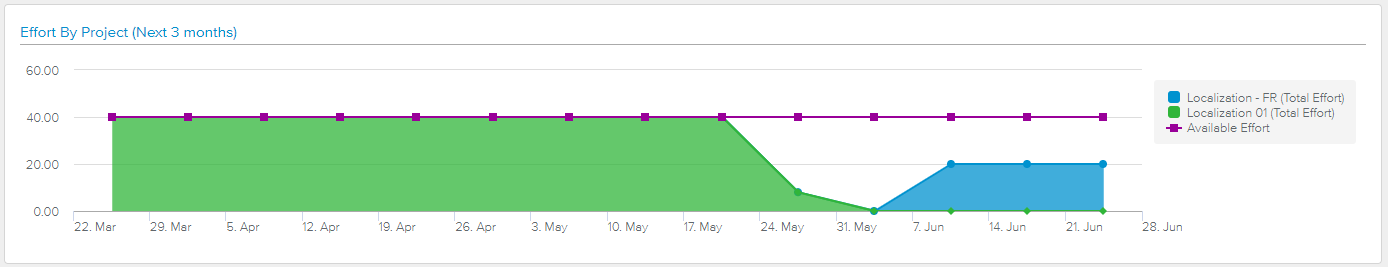
If the Charts ( ) display option is activated, the Effort By Project chart is displayed above the spreadsheet.
The chart section and display option are only available if there is some planned effort for the next three months.
The Effort By Project chart offers a visual breakdown of effort, with a different colored layer for each project. The effort is charted starting from the current date for three months.
If the Allocations feature is enabled, the user can change the display ( ) to view the Allocated Effort By Project chart.
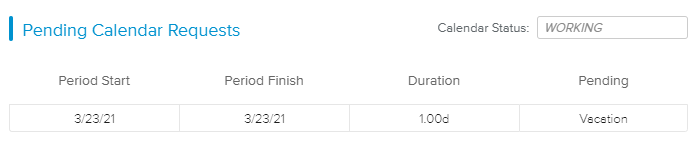
The Pending Calendar Requests spreadsheet identifies any date ranges that are different from those specified in the pending and active calendars of the logged-in user. A read-only field also indicates the calendar status.
The Pending Timesheets spreadsheet lists the logged-in user Timesheets (by week) whose Status is “Submitted” or “Rework”.
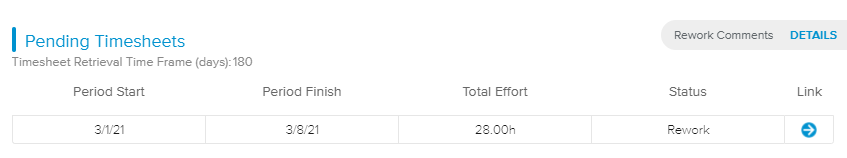
Upon clicking on the Link ( ) button, the view switches to the Timesheet workspace, with the corresponding time period displayed.
If the Enable Comments upon Rework State option has been activated by the Administrator, Resource and Project Managers will be able to add a comment when sending back the Timesheet to the Team Member. In this case, the Rework Comments alert display will differ depending on whether or not some unread comments are available:
Blue – No unread comments
Red – Unread comment(s)
Upon clicking on the alert “Details” label, the Rework Comments History dialog box is displayed, allowing the user to read and manage the comments.
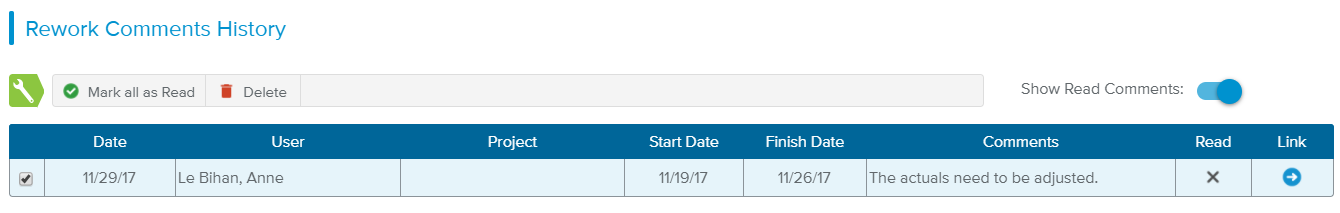 |
The Rework Comments History dialog box makes available the following tools:
 | Mark all as Read | (located in the toolbar above the spreadsheet) – Marks all the comments of the spreadsheet as read. |
 | Delete | Allows the user to delete the comment. This command is only available if at least one comment is selected (i.e., the corresponding checkbox is ticked). |
| Link | Closes the dialog box and switches the Timesheet view to the time period corresponding to the comment. |
| Read | Indicates the comment as read. Upon clicking on it, the icon changes to an unread icon. Read comments will not be displayed unless the Show Read Comments switch button is activated. |
 | Unread | Marks the comment as unread. Upon clicking on it, the icon becomes a read icon, and the comment is no longer displayed in the spreadsheet unless the Show Read Comments switch button is activated. |
The Administrator can activate the Rework Comments by switching on the "Enable Comments upon Rework State" setting available in the System Settings workspace, Project Settings folder, Time Tracking Options tab.