The Assignments Scheduling full screen view aims at providing both the Gantt feature and the resource utilization spreadsheets in a single view.
This full screen view is accessible upon clicking on the Assignments Scheduling ( ) button available in the main toolbar.
While opening the full screen view, the selected project(s) will be automatically locked, allowing the Undo/Redo operations. While closing the popup, the lock(s) will be removed.
The Task-Driven Review tab has been designed to:
Facilitate the review and update of the selected Task Labor Assignment, and
Review the impacts of a Task modification on the Resource assignments and availability.
The Filters panel allows the user to narrow down the list of Tasks displayed in the Gantt chart. Most filters are common to the Gantt Filters dialog box.
The Filters panel can be displayed or hidden using the following buttons:
 | Show | Allows the user to display the panel. When some filters are active, the icon is displayed in blue. |
 | Close | Allows the user to hide the panel. |
The Display Tasks option available in the top of the panel allows the user to filter the Gantt Task based on whether or not they have some effort in the selected time frame as follows:
With Effort in the Period – Displays only the tasks for which there is some Effort in the selected time frame.
With Effort in the past Period – Displays only tasks for which there is some Effort in the selected time frame and the previous time frame (based on the selected intervals and number of intervals).
With Effort in the next Period – Displays only tasks for which there is some Effort in the selected time frame and in the next time frame (based on the selected intervals and number of intervals).
All – Displays all the tasks, regardless of the time frame selected or the effort.
The following filtering options are available:


At the bottom of the panel, the Reset button is displayed, allowing the user to clear all the filtering fields at once.
The Gantt section displays the filtered version of the Gantt view, with a graphic pane displaying only the time frame selected in the Time Navigation toolbar.
By default, the period will be set to display the next six months and only the Tasks with effort on this period.
The Insert Tasks area gives users the opportunity to insert one or more tasks simultaneously into the project.
In order to insert some tasks, the user needs first to select the number of tasks that are to be created in the drop-down list, and then click on the Insert Tasks ( ) button.
The following options are available when inserting a task:
Insert Before | New rows for the newly created tasks will be inserted in the Gantt spreadsheet above the selected task at the same WBS level. |
Insert After | New rows for the newly created tasks will be inserted in the Gantt spreadsheet beneath the selected task at the same WBS level. |
Insert Children | New rows for the newly created tasks will be inserted as children in the Gantt spreadsheet beneath the selected task. If there are assignments on the new Parent task, then a pop-up will be displayed, warning the user that the assignments of the task will be deleted. |
If no task is selected when the Insert Tasks button is clicked, the new tasks created appear at the end of the list.
The commands available in this area may vary depending on the selected workspace or view mode. However, the most common commands are the following:
 | Insert Template | Allows the user to insert a Template as follows:
|
 | Indent | Allows the user to move the task one level lower in the WBS hierarchy. |
 | Outdent | Allows the user to move the selected task one level higher in the WBS hierarchy. |
 | Delete | Allows the user to delete the selected task(s). |
 | Summarize At Level | Allows the user to specify the level of detail (number of levels of descendant tasks) to display. |
 | Assign Resources | Provides access to the following commands:
|
 | Remove Resources | Provides access to the following commands:
|
 | More | Provides access to the following additional commands:
|
 | Critical Chain | The Critical Chain button is only available when the project Schedule Method is set to "Critical Chain". The following commands can be displayed: Define Critical Chain, Add Critical Chain Resource Links, Remove Critical Chain Resource Links, Insert Buffers, Update Buffers, Dissolve Buffers, CC Save Baseline (in Tracking Mode only), CC Remove Baseline (in Tracking Mode only), and Remove Critical Chain. |
The Gantt spreadsheet displays the following Tasks attributes: #, Name, Duration, Start, and Finish.
The Gantt chart Cmd (for Command) column provides the following Gear icons:
 | Gear | Indicates that the corresponding task is not linked to another object. |
 | Agile | Indicates that the corresponding task is linked to an Agile object. |
 | Dependency | Indicates that the corresponding task has an Inbound Dependency. |
 | Work Package | Indicates that the corresponding task is a Work Package. |
Upon clicking on the Gear button, the following commands are displayed:
Edit Task details | Opens the Task Details dialog box, allowing the user to view and edit all the selected task information. |
Mark Task as Closed | Checks the task Closed field. |
Mark Task as Opened | Unchecks the task Closed field (this command is only available if the task has previously been marked as Closed). |
Add Task to Watch list | Allows the user to review the task by using the Watch List built-in filter (Filters dialog box). |
Remove Task from Watch list | The Task will no longer be displayed when using the Watch List built-in filter (Filters dialog box). |
Disable Timesheet Add Assignment | Upon using this command, users will no longer be able to assign themselves to the task when using the Add Assignment command in the Timesheet workspace. |
Allow Timesheet Add Assignment | Upon clicking on it, users will be able to assign themselves to the task when using the Add Assignment command in the Timesheet workspace. This command is only available if the "Disable Timesheet Add Assignment" command has previously been used on the selected task. |
Create Agile Object | Allows the user to create a new Agile Object (Release, Iteration, or Epic) which will be linked to the corresponding task. |
Convert to Work Package | Displays the Convert to Work Packages popup, allowing the user to enter a Name and a Work Package ID for the new Work Package. |
Create Dependency | Displays the Create a New Dependency popup, allowing the user to select the Mapping Type and the relationship for the new Dependency to create. |
Create Sub-Project | Allows the user to create a new project with a Hierarchy Connection. Note The dates of the newly created project will be defined as follows: The Project Start Constraint will correspond to the Task Start date, and the Project Deadline will correspond to the Task Required Date. |
Tag Task | Displays the Tags dialog box, allowing the user to create project tags and add some of them to the currently selected task. |
The Drag & Drop capability allows users to change the position of one or several tasks in the Gantt. This operation is available for contiguous tasks only.
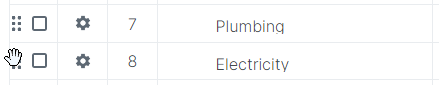
The user simply needs to hold down the left mouse button to grab the handle (grey part located on the left-hand side of a task checkbox) of the task or tasks selected.
As a consequence, a thick blue line appears on the spreadsheet, indicating where the selected task(s) are to be dropped. When dragging the tasks, the user can scroll to reach parts of the Gantt spreadsheet that are not within the immediate range.
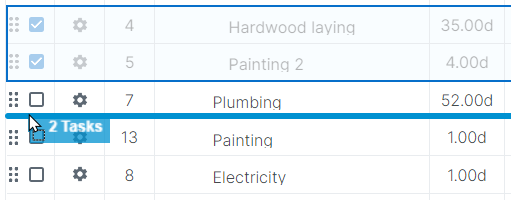
Upon releasing the mouse button, the tasks are dropped to the selected position (represented by a thick blue line).
Pressing the Esc. key when performing a drag & drop will cancel the operation.
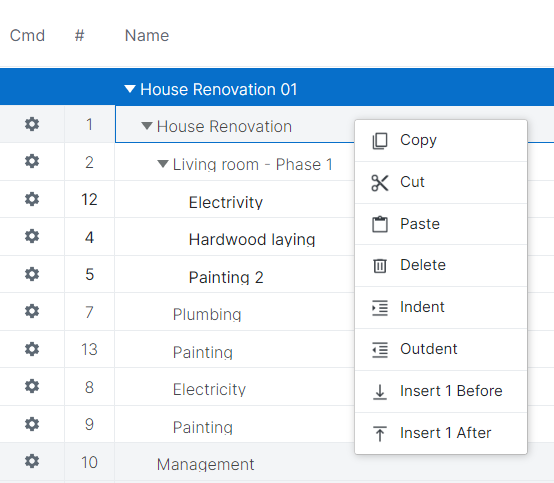
When the user does a right-click on the selected tasks, the following commands are displayed: Copy, Cut, Paste, Delete, Indent, Outdent, Insert Before, and Insert After.
Please do not forget that the copy, cut, and paste capabilities behave differently depending on whether the content has been implicitly (specific cells) or explicitly (entire row) selected.
If several tasks are selected, the Insert Before and Insert After commands will specify the number of selected tasks. Clicking on the Insert before or Insert after commands will then insert an equal number of tasks.
Also, upon clicking on the “Add More Tasks” button located in the bottom of the spreadsheet, ten new task rows will be added at the end of the task list.
The Gantt chart is a graphical depiction of a project schedule. It's is a type of bar chart that shows the start and finish dates of several elements of a project that include resources, milestones, tasks, and dependencies.
The Gantt chart legend is the following:
Information | Corresponding display |
|---|---|
Completed task |
|
Current baseline |
|
Scheduled task |
|
Free float |
|
Total float |
|
Critical, scheduled task |
|
Critical, completed task |
|
Negative float |
|
Parent task |
|
Parent, completed task |
|


Date constraints and milestones appear as follows:
Information | Corresponding display |
|---|---|
Must Start On |
|
Start No Earlier Than |
|
Required date |
|
Milestone |
|


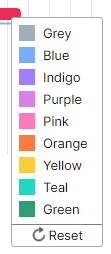
The color of a specific Gantt bar can be changed upon right-clicking on the bar, then selecting the “Change Color” command to display the color panel and select the new color. When a new color is selected, the entire bar color is changed and the task’s attributes (float, completion, etc.) are displayed with a color graduation.
A “Reset” button is available so the color can be reset back to the original one.
The Gantt chart’s cursors legend is the following:
Action | Corresponding display | How to access |
|---|---|---|
Set/Change the % Completed |
| To set the % Completed for the first time on a task, users will either need to hover the left-hand side of the bar and hold down the Ctrl key, or right-click on the bar, then select the “Update Completion” command to display the “Update Completion” popup and select a Completed Date. 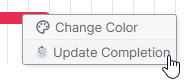 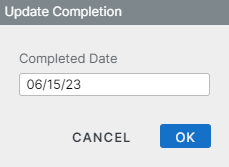 Once the % Completed has already been set on a task, the cursor will be displayed upon hovering the right-hand side of the completed portion of the bar, allowing users to change it. 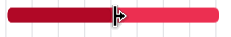 |
Create a link |
| Users will first hover the bar. 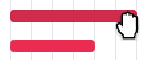 Then click to link to the second bar to create the link. 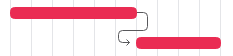 |
Decrease/increase duration |
| While hovering the left-hand side or right-hand side of the Gantt bar. 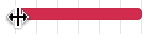 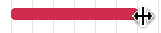 |
Shift a task |
| While hovering the bar. 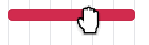 |
| While pressing. 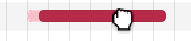 | |
Split a task |
| While hovering the bar and holding down the Shift key. 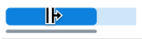 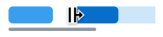 |


For milestones, the cursors legend is the following:
Action | Corresponding display | How to access |
|---|---|---|
Create a link |
| Users will first hover the milestone, then click to the bar to create the link.  |
Shift a milestone |
| While hovering the milestone. |
| While pressing. |


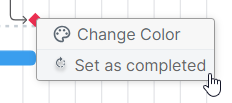
To set the % Completed for the first time on a milestone, users will need to hover the milestone and select the “Set as completed” command.
Once the milestone has been set as completed, the Increase duration cursor can be displayed upon hovering the milestone and holding down the Ctrl button.

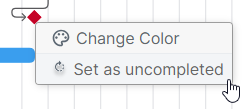
To cancel the operation, users will need to hover the milestone and select the “Set as uncompleted” command.
The Task Assignments section displays information regarding the assignments of the selected Task.
The following view modes are provided:
 | Details | Provides the selected task's assignments time distributed effort for the selected time period. |
 | List | Provides the selected task's assignments in the form of a flat list, with the overall values (not based on the selected time frame). |
When no Task is selected, an empty state will be available to guide the user.
As soon as a Task is selected (implicit selection by clicking on a cell or explicit selection by clicking the checkbox), the task labor assignment details will be displayed.
Only one task can be selected at a time.
The Details mode () provides the list of hard and soft assignments of the selected task, with the corresponding time-distributed Actual, Remaining, and Total Effort.
The following tools are available to manage the Task Assignments:
Colored indicators are provided to highlight the % shift between the resources Total Effort and Remaining Usable Effort. The user can access the legend of the colored indicators by clicking on the Legend ( ) button located in the bottom right corner of the view.
Colored indicators are defined by the Administrator in the System Settings workspace, General Settings folder, Colored Indicators tab, Resource Utilization Preferences.
Upon clicking on Resource name, the Resource Assignment Details full screen view is displayed, providing the details of all the assignments for the selected resource.
If the Contract Type feature is enabled, External Resources will be flagged with the External ( ) icon.
The List mode () provides the list of hard and soft assignments of the selected task, in a format that allows to easily edit the corresponding attributes.
Users will be able to view and edit the following information: Resource Name, Organization, Job Classification, Skills, Distribution Type, Rate, Actual Effort, Remaining Effort, and Total Cost (read-only).
The following tools are available:
| New Assignment | Adds a new row to the spreadsheet, allowing the user to create a new labor assignment. |
 | Delete | Allows the user to delete the selected assignment(s). This command is only available if at least one assignment is selected (i.e., the corresponding checkbox is ticked). |
 | Details | Opens the corresponding Labor Assignment dialog box. |
The Assignment-Driven Review tab has been designed to:
Review the list of Tasks a resource has been assigned to for a given time period, and
Review the potential impacts of a Labor Assignment modification on the Gantt schedule.
The Filters panel allows the user to narrow down the list of assignments displayed in the spreadsheet.
The Filters panel can be displayed or hidden using the following buttons:
| Show | Allows the user to display the panel. When some filters are active, the icon is displayed in blue. |
| Close | Allows the user to hide the panel. |
The following filtering options are available:
At the bottom of the panel, the Reset button is displayed, allowing the user to clear all the filtering fields at once.
The Assignments section displays a spreadsheet listing all the assigned resources (and soft assignments) with the corresponding time-distributed Total Effort for the corresponding time frame.
Upon expanding the resource's row, additional information regarding the Usable Effort, as well as the details of the assignments is displayed as well.
The last column shows the Total values for the selected time period.
The following tools are provided:
| New Assignment | Allows the user to create a new Hard or Soft Assignment. |
 | Group By | Allows the user to group the resources by Organization, Job Classification, or Contract Type. |
 | Search | Allows the user to search for a specific resource based on its name. |
Review | Allows the user to select a resource to review. Upon doing so, the corresponding tasks are displayed in the Tasks section, and the "Remove" button is displayed. Important The user can review up to 5 elements at once. | |
Remove | Allows the user to deselect a resource to review. Upon doing so, the corresponding tasks are no longer displayed in the Tasks section, and the "Review" button is displayed. | |
 | Add Assignment | Prompts the user to select a Task to which the corresponding resource will be assigned. |
 | Uniform | Indicates that only uniform assignment is allowed. Upon clicking on this icon, the assignment allows non-uniform assignment. |
 | Non Uniform | Indicates that non-uniform assignment is allowed. Upon clicking on it, the assignment only allows uniform assignment. |
 | More | Provides access to the following commands:
|
Colored indicators are provided to highlight the % shift between the resources Total Effort and Usable Effort. The user can access the legend of the colored indicators by clicking on the Legend () button located in the bottom right corner of the view.
Colored Indicators are defined by the Administrator in the System Settings workspace, General Settings folder, Colored Indicators tab, Resource Utilization Preferences.
The user can also take advantage of the Review Resources ( ) button in the main toolbar to select resources to review. Selected resources are then displayed in the form of a chip.
The Reset button located in the upper right corner of the view allows the user to clear the selected resources (both nominative and soft assignments).
Clicking on the REVIEW button will trigger the selection of a Resource or a Soft Assignment and display the Tasks on which the Resource or Soft Assignment is assigned to in the Gantt section. When an item is selected, the button will be replaced by REMOVE.
The selection of only five Resource or Soft Assignments is supported. When this limit is reached, the REVIEW button and the () button will turn grey as disabled.
Clicking on the Origin chip (indicating if the resource has been added to the Project Team manually or through a Resource Acquisition Capability) opens the corresponding Team Member Details dialog box.
The Origin of Allocated, Committed, and Dedicated resources is displayed differently depending on the situation:
 | Blue | Indicates that the resource is “active” (the allocation Finish Date is in the future). |
 | Grey | Indicates that the resource is “inactive” (the allocation Finish Date is in the past). |
The Tasks section displays a Gantt filtered based on the selected assignment, with a graphic pane displaying only the time frame selected in the Time Navigation toolbar.
The title of the section indicates the selected soft or hard assignments (up to 5).
The Insert Tasks area gives users the opportunity to insert one or more tasks simultaneously into the project.
In order to insert some tasks, the user needs first to select the number of tasks that are to be created in the drop-down list, and then click on the Insert Tasks () button.
The following options are available when inserting a task:
Insert Before | New rows for the newly created tasks will be inserted in the Gantt spreadsheet above the selected task at the same WBS level. |
Insert After | New rows for the newly created tasks will be inserted in the Gantt spreadsheet beneath the selected task at the same WBS level. |
Insert Children | New rows for the newly created tasks will be inserted as children in the Gantt spreadsheet beneath the selected task. If there are assignments on the new Parent task, then a pop-up will be displayed, warning the user that the assignments of the task will be deleted. |
If no task is selected when the Insert Tasks button is clicked, the new tasks created appear at the end of the list.
The commands available in this area may vary depending on the selected workspace or view mode. However, the most common commands are the following:
| Insert Template | Allows the user to insert a Template as follows:
|
| Indent | Allows the user to move the task one level lower in the WBS hierarchy. |
| Outdent | Allows the user to move the selected task one level higher in the WBS hierarchy. |
| Delete | Allows the user to delete the selected task(s). |
| Summarize At Level | Allows the user to specify the level of detail (number of levels of descendant tasks) to display. |
| Assign Resources | Provides access to the following commands:
|
| Remove Resources | Provides access to the following commands:
|
| More | Provides access to the following additional commands:
|
| Critical Chain | The Critical Chain button is only available when the project Schedule Method is set to "Critical Chain". The following commands can be displayed: Define Critical Chain, Add Critical Chain Resource Links, Remove Critical Chain Resource Links, Insert Buffers, Update Buffers, Dissolve Buffers, CC Save Baseline (in Tracking Mode only), CC Remove Baseline (in Tracking Mode only), and Remove Critical Chain. |
The Gantt spreadsheet displays the following Tasks attributes: #, Name, Duration, Start, and Finish.
The Gantt chart Cmd (for Command) column provides the following Gear icons:
| Gear | Indicates that the corresponding task is not linked to another object. |
| Agile | Indicates that the corresponding task is linked to an Agile object. |
| Dependency | Indicates that the corresponding task has an Inbound Dependency. |
| Work Package | Indicates that the corresponding task is a Work Package. |
Upon clicking on the Gear button, the following commands are displayed:
Edit Task details | Opens the Task Details dialog box, allowing the user to view and edit all the selected task information. |
Mark Task as Closed | Checks the task Closed field. |
Mark Task as Opened | Unchecks the task Closed field (this command is only available if the task has previously been marked as Closed). |
Add Task to Watch list | Allows the user to review the task by using the Watch List built-in filter (Filters dialog box). |
Remove Task from Watch list | The Task will no longer be displayed when using the Watch List built-in filter (Filters dialog box). |
Disable Timesheet Add Assignment | Upon using this command, users will no longer be able to assign themselves to the task when using the Add Assignment command in the Timesheet workspace. |
Allow Timesheet Add Assignment | Upon clicking on it, users will be able to assign themselves to the task when using the Add Assignment command in the Timesheet workspace. This command is only available if the "Disable Timesheet Add Assignment" command has previously been used on the selected task. |
Create Agile Object | Allows the user to create a new Agile Object (Release, Iteration, or Epic) which will be linked to the corresponding task. |
Convert to Work Package | Displays the Convert to Work Packages popup, allowing the user to enter a Name and a Work Package ID for the new Work Package. |
Create Dependency | Displays the Create a New Dependency popup, allowing the user to select the Mapping Type and the relationship for the new Dependency to create. |
Create Sub-Project | Allows the user to create a new project with a Hierarchy Connection. Note The dates of the newly created project will be defined as follows: The Project Start Constraint will correspond to the Task Start date, and the Project Deadline will correspond to the Task Required Date. |
Tag Task | Displays the Tags dialog box, allowing the user to create project tags and add some of them to the currently selected task. |
The Gantt chart is a graphical depiction of a project schedule. It's is a type of bar chart that shows the start and finish dates of several elements of a project that include resources, milestones, tasks, and dependencies.
The Gantt chart legend is the following:
Information | Corresponding display |
|---|---|
Completed task |
|
Current baseline |
|
Scheduled task |
|
Free float |
|
Total float |
|
Critical, scheduled task |
|
Critical, completed task |
|
Negative float |
|
Parent task |
|
Parent, completed task |
|
Date constraints and milestones appear as follows:
Information | Corresponding display |
|---|---|
Must Start On |
|
Start No Earlier Than |
|
Required date |
|
Milestone |
|
The color of a specific Gantt bar can be changed upon right-clicking on the bar, then selecting the “Change Color” command to display the color panel and select the new color. When a new color is selected, the entire bar color is changed and the task’s attributes (float, completion, etc.) are displayed with a color graduation.
A “Reset” button is available so the color can be reset back to the original one.
The Gantt chart’s cursors legend is the following:
Action | Corresponding display | How to access |
|---|---|---|
Set/Change the % Completed |
| To set the % Completed for the first time on a task, users will either need to hover the left-hand side of the bar and hold down the Ctrl key, or right-click on the bar, then select the “Update Completion” command to display the “Update Completion” popup and select a Completed Date. Once the % Completed has already been set on a task, the cursor will be displayed upon hovering the right-hand side of the completed portion of the bar, allowing users to change it. |
Create a link |
| Users will first hover the bar. Then click to link to the second bar to create the link. |
Decrease/increase duration |
| While hovering the left-hand side or right-hand side of the Gantt bar. |
Shift a task |
| While hovering the bar. |
| While pressing. | |
Split a task |
| While hovering the bar and holding down the Shift key. |
For milestones, the cursors legend is the following:
Action | Corresponding display | How to access |
|---|---|---|
Create a link |
| Users will first hover the milestone, then click to the bar to create the link. |
Shift a milestone |
| While hovering the milestone. |
| While pressing. |
To set the % Completed for the first time on a milestone, users will need to hover the milestone and select the “Set as completed” command.
Once the milestone has been set as completed, the Increase duration cursor can be displayed upon hovering the milestone and holding down the Ctrl button.
To cancel the operation, users will need to hover the milestone and select the “Set as uncompleted” command.