The Master Planning workspace provides executives with a simpler and quicker way to monitor the key projects of their organization.
The Master Planning workspace allows the user to:
Build the Master Planning (by selecting multiple projects).
Understand how the projects are correlated with one another (Gantt view).
Quickly understand the changes that have occurred since the last synchronization.
Analyze how projects are doing (KPIs).
Review the Project Brief to get more details.
Drill down to a specific Project if necessary (being able to edit the project attributes if needed).
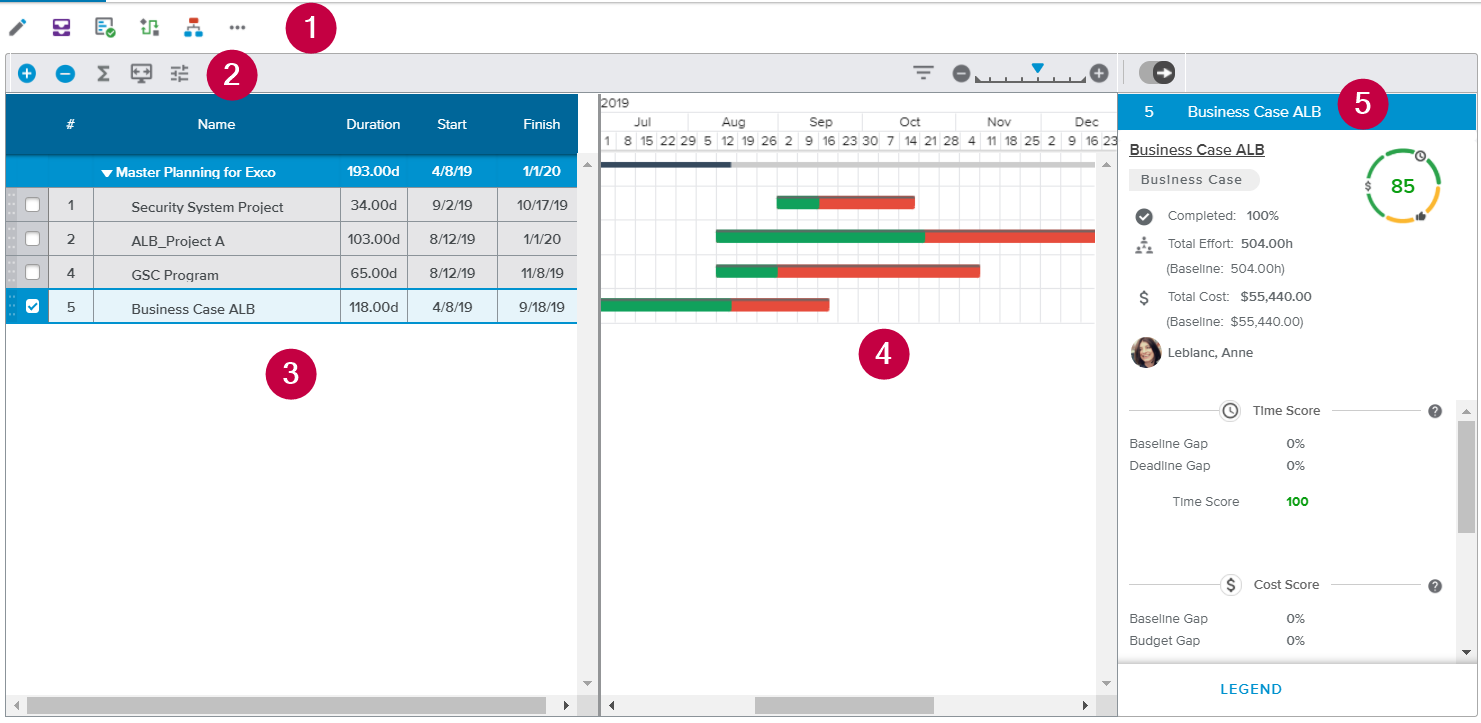
The Master planning workspace is made up of:
The Main toolbar
The Gantt toolbar
The Gantt spreadsheet
The Gantt chart
The Side panel
The main toolbar is located on the top of the view and aims at providing the most important project information and commands.
Here is the list of the buttons users can encounter in the Master Planning workspace:
 | New | Allows the user to create a new project object. |
 | Publish | Publishes any changes to the current project, but only if the current project is the active Working version. |
 | Edit | Opens the Project Administration dialog box. |
 | Manage Baselines | Opens the Manage Baselines dialog box. |
 | Workflow Actions | Allows the user to modify the Workflow State Vote associated with the project. |
 | Workflow | Displays the Workflow Information dialog box. |
 | More | Provides access to the following commands:
|
 | Status Report History | Opens the Status Report History full screen view. |
Here is the list of the buttons and options users can encounter in the Master Planning workspace:
 | Add | Provides access to the following commands:
Note Once an object has been added, it is displayed in the form of a Task in the Master Planning and the corresponding Copy Dependency is created. |
 | Remove | Removes the selected Project or Task from the Master Planning and deletes the corresponding Dependency. |
 | Summarize at Level | The Summarize command available in the Gantt view toolbar displays the Summarized at Level dialog box, where the user can specify the level of detail (number of levels of descendant tasks) to display. |
 | Scroll Into view | Allows the user to scroll the selected task automatically into the visible area of the Gantt chart graphic pane. |
 | Filters | Enables the user to open the Gantt Filters dialog box, in order to select built-in filters for filtering project tasks. |
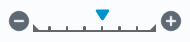
| Allows the user to zoom in and zoom out in the Gantt chart graphic pane. |
The Gantt spreadsheet displays the following Tasks attributes: #, Name, Duration, Start, and Finish.
For implicit task selection, the user clicks in one or several cells (using the Shift key or holding down on the mouse left button). To implicitly select tasks, the user must keep in mind the following:
The tasks are to be selected by clicking in the corresponding cell.
Commands will apply to the selected tasks.
The Copy and Cut capabilities will operate on the selected cells only.
It is only possible to select contiguous tasks. For instance, if there are five tasks that are numbered 1 to 5 in that order, it is not possible to implicitly select task 1 and task 4 at the same time.

For explicit task selection, the user ticks the task checkbox located in the leftmost column of the spreadsheet. To explicitly select tasks, the following apply:
The tasks are to be selected (by ticking the checkboxes in the leftmost column).
Commands will apply to the selected tasks.
The Copy and Cut capabilities will operate on the entirety of the selected tasks.
It is possible to select tasks that are either contiguous or noncontiguous.

When tasks are explicitly selected, the background color of the checkbox cell (leftmost column of the spreadsheet) turns blue.
For browser security reasons, access to the user’s clipboard can be blocked, so we strongly advise using the keyboard shortcuts when copying and pasting information from another software to Sciforma, or from Sciforma to another software. The following shortcuts could be applied:
Copy: Ctrl + C
Cut: Ctrl + X
Paste: Ctrl + V
Copy, Paste, and Cut commands can still be used “within Sciforma” by accessing the built-in Context menu (right-click).
It is possible to create up to a hundred tasks at a time when using the copy/cut/paste commands.
Please note the following when pasting within a row of the Gantt chart:
If you paste in the last row (blank) of the Gantt chart, all copied or cut tasks are going to be added after the last task listed in the Gant.
If you paste several implicitly selected rows, make sure an equivalent number of empty rows has already been created. Otherwise, the existing rows that follow will be replaced by the pasted/inserted rows.
If you paste several explicitly selected rows, Sciforma will automatically create new rows for those tasks. They will be inserted above the selected task.
When pasting explicitly, assignments will also be copy-pasted.
Please do not forget that the copy, cut, and paste capabilities behave differently depending on whether the content has been implicitly (specific cells) or explicitly (entire row) selected.
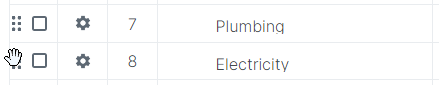
The Drag & Drop capability allows users to change the position of one or several tasks in the Gantt. This operation is available for contiguous tasks only.
The user simply needs to hold down the left mouse button to grab the handle (grey part located on the left-hand side of a task checkbox) of the task or tasks selected.
As a consequence, a thick blue line appears on the spreadsheet, indicating where the selected task(s) are to be dropped. When dragging the tasks, the user can scroll to reach parts of the Gantt spreadsheet that are not within the immediate range.
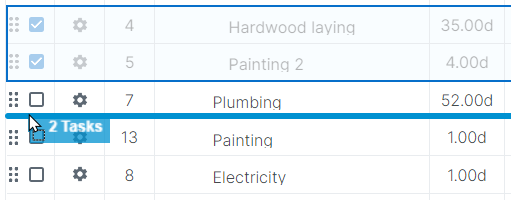
Upon releasing the mouse button, the tasks are dropped to the selected position (represented by a thick blue line).
Pressing the Esc. key when performing a drag & drop will cancel the operation.
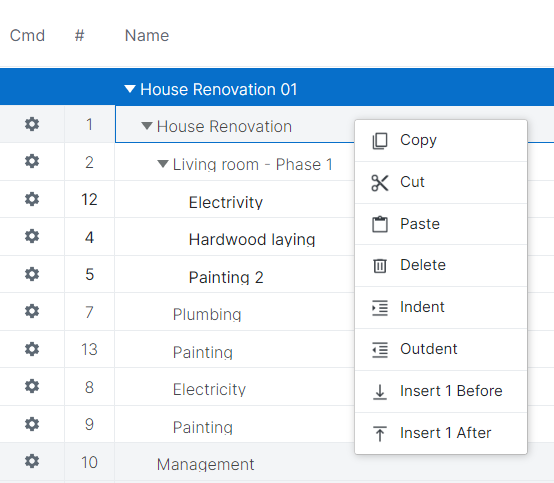
When the user does a right-click on the selected tasks, the following commands are displayed: Copy, Cut, Paste, Delete, Indent, Outdent, Insert Before, and Insert After.
Please do not forget that the copy, cut, and paste capabilities behave differently depending on whether the content has been implicitly (specific cells) or explicitly (entire row) selected.
If several tasks are selected, the Insert Before and Insert After commands will specify the number of selected tasks. Clicking on the Insert before or Insert after commands will then insert an equal number of tasks.
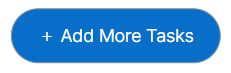
Also, upon clicking on the “Add More Tasks” button located in the bottom of the spreadsheet, ten new task rows will be added at the end of the task list.
The Gantt chart is a graphical depiction of a project schedule. It's is a type of bar chart that shows the start and finish dates of several elements of a project that include resources, milestones, tasks, and dependencies.
The Gantt chart legend is the following:
Information | Corresponding display |
|---|---|
Completed task |
|
Current baseline |
|
Scheduled task |
|
Free float |
|
Total float |
|
Critical, scheduled task |
|
Critical, completed task |
|
Negative float |
|
Parent task |
|
Parent, completed task |
|


Date constraints and milestones appear as follows:
Information | Corresponding display |
|---|---|
Must Start On |
|
Start No Earlier Than |
|
Required date |
|
Milestone |
|


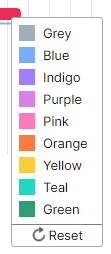
The color of a specific Gantt bar can be changed upon right-clicking on the bar, then selecting the “Change Color” command to display the color panel and select the new color. When a new color is selected, the entire bar color is changed and the task’s attributes (float, completion, etc.) are displayed with a color graduation.
A “Reset” button is available so the color can be reset back to the original one.
The Gantt chart’s cursors legend is the following:
Action | Corresponding display | How to access |
|---|---|---|
Set/Change the % Completed |
| To set the % Completed for the first time on a task, users will either need to hover the left-hand side of the bar and hold down the Ctrl key, or right-click on the bar, then select the “Update Completion” command to display the “Update Completion” popup and select a Completed Date. 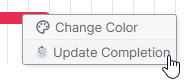 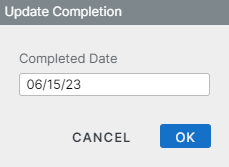 Once the % Completed has already been set on a task, the cursor will be displayed upon hovering the right-hand side of the completed portion of the bar, allowing users to change it. 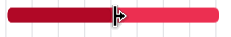 |
Create a link |
| Users will first hover the bar. 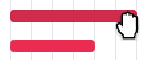 Then click to link to the second bar to create the link. 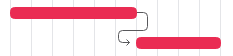 |
Decrease/increase duration |
| While hovering the left-hand side or right-hand side of the Gantt bar. 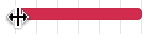 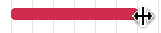 |
Shift a task |
| While hovering the bar. 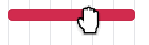 |
| While pressing. 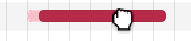 | |
Split a task |
| While hovering the bar and holding down the Shift key. 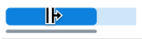 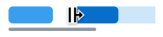 |


For milestones, the cursors legend is the following:
Action | Corresponding display | How to access |
|---|---|---|
Create a link |
| Users will first hover the milestone, then click to the bar to create the link.  |
Shift a milestone |
| While hovering the milestone. |
| While pressing. |


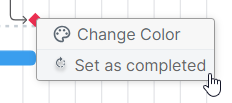
To set the % Completed for the first time on a milestone, users will need to hover the milestone and select the “Set as completed” command.
Once the milestone has been set as completed, the Increase duration cursor can be displayed upon hovering the milestone and holding down the Ctrl button.

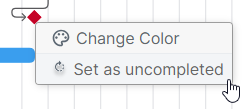
To cancel the operation, users will need to hover the milestone and select the “Set as uncompleted” command.
The Master Planning workspace side panel differs depending on the Task selection.
When no task is selected in the Master Planning Gantt spreadsheet, the side panel provides the list of projects belonging to the Master Planning in the form of cards.
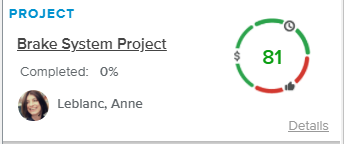
Each card provides the following information: Nature, Name of the project, Name of the task (if any), Health Score, % Completed, and Manager 1.
The maximum number of project cards displayed is defined by the Administrator using the “Set Scheduler Max. Number of Task Cards” option, available in the System Settings workspace, General Settings folder, Display Controls tab.
In the upper part of the panel, the Sort By ( ) display option is available, allowing the user to sort by the projects in Alphabetical order (default) or by Health Score (in ascending order).
Clicking on the Health Score provides the Health Score Details, which includes the Legend for the Health Score colored indicators.
Upon clicking on the Source Project name, the corresponding Brief dialog box will be displayed.
Upon clicking on the Details label of a card, the side panel drills down to the project level, providing information about the Source Project and the Dependency (similar to the view displayed when a Task is selected).
If at least one Task is not synchronized with the corresponding target object, the  button is displayed at the bottom of the panel, allowing the user to synchronize the dependency.
When the selected Task is linked to another Project (or Task) through a Dependency, the side panel will display detailed information regarding the Source object and the dependency.
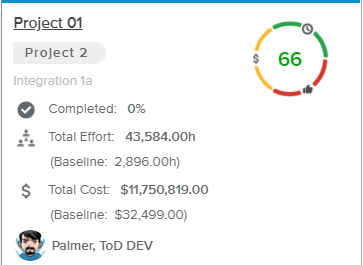
The following project attributes will be displayed: Project Name, Workflow State Vote, Task Name (if any), Manager 1, % Completed, Total Effort, Baseline Effort, Total Cost, Baseline Cost, Type, and Health Score.
Clicking on the Health Score provides the Health Score Details, which includes the Legend for the Health Score colored indicators.
The lower section of the side panel provides the details of the Health Score per category (Time, Cost, and Quality). Clicking on the Question Mark icon ( ) will provide a detailed definition regarding the score.
Clicking on the Legend label located in the panel footer provides the Legend for the Health Score colored indicators.
The Health Score colored indicator ranges can be defined by the Administrator in the System Settings workspace, General Settings folder, Colored Indicators tab.
Clicking on the Focus button located in the panel footer opens the project’s Focus Mode full screen view.
The project Focus Mode full screen view provides the same features as the usual project workspaces. Please refer to the corresponding topics for more information.