Project managers, sponsors and the project team are often so involved in the day-to-day activities that they can fail to recognize the true status of a project.
The project Health Score indicator is based on objective and quantitative values and allows the user to identify at a glance how the project is doing. In this way, project managers can be proactive and anticipate potential slippages when projects are failing or leaning in the wrong direction.
In Sciforma, the Health Score includes assessment of three indicators: Cost, Quality and Time, which corresponds to the Project Management Iron Triangle.
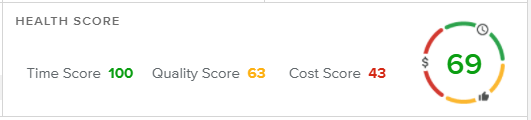
The Global Score is the combination of Cost, Quality and Time values will result in a global score, whose maximum value will be 100.
Global Score = (Time Weight x Time Score + Cost Weight x Cost Score + Quality Weight x Quality Score) / (Sum of Weights)
The higher the score, the healthier the project is.
Be aware that all Score Indicators are Integers. Thus, some values might be rounded up.
To ease the Projects Health Score analysis, we strongly encourage companies to use the same indicators across projects.
For example, if one project has a deadline and another doesn't, the Time Score will not measure the same indicators, which could be annoying.
The Default Values of the Cost, Time and Quality weights can be defined:
For the Entire System
At the Project level
Each weight value will be defined as:
High priority (=3)
Medium priority (=2)
Low priority (=1)
Two indicators can have the same value.
Health score can also be only available for certain Project Natures: Business Case, Project, Program, and Product.
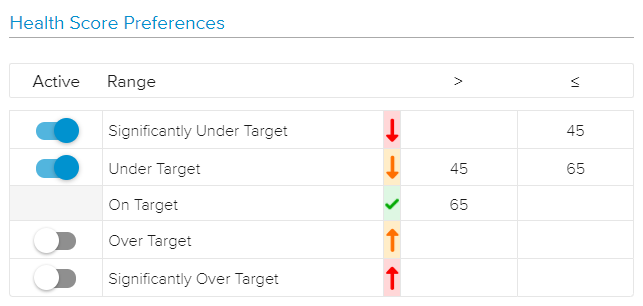
The health indicators (also referred to as RAG, or red-amber-green indicators) are automatically computed by Sciforma and are used primarily for project status reporting, aimed at measuring progress, identifying the need for corrective action, and for managing stakeholder expectations.
The only way for health indicators to be effective is for the project team to have a common understanding of what each color indicates. This could differ from one organization to another, but these are the recommended definitions:
GREEN: The identified aspect of the project is not at risk of negatively impacting the project and the project is performing according to the original plan. No corrective action or measures are required.
AMBER: A problem exists that may negatively impacts the project's objectives, but can still be dealt.
RED: Significant issues exist that require corrective actions to ensure the project meets its initial objectives.
In Sciforma, the colored indicators can be modified by the Administrator.
The Time Score is calculated based upon the Baseline gap value, the Deadline gap value, the Agile value, the Phases & Gates value, and the CCPM value.
The Time Score value can be made up of 5 Time Indicators:
Baseline Gap
Deadline Gap
Agile
Phases & Gates OTD
CCPM
Time Score value = 100 - ((Baseline gap value + Deadline gap value + Agile value + (100 – Phases & Gates value) + CCPM value) / (Number of Time Indicators))
Example:
Let's imagine a project with the following 3 Time Indicators:
Baseline Gap: 14%
Deadline Gap: 10%
Phases & Gates OTD: 20%
The Time Score value will be 50.
Time Score = 100 – ((14 + 10 + (100 – 20)) / 3) = 50
The Baseline gap value will be computed only if a Project Baseline has been saved.
Note that if you have saved multiple baselines, Sciforma will take into account the Current Baseline.
The value corresponds to the average of the Start Baseline Gap and Finish Baseline Gap values, where:
Start Baseline Gap: Comparison between the Project Start and the Current Baseline Start (proportional to the Project Duration).
Finish Baseline Gap: Comparison between the Project Finish and the Current Baseline Finish (proportional to the Project Duration).
The Deadline gap value will be computed only if a Project Deadline has been set up.
The value is the comparison between Project Finish date and Project Deadline (proportional to the Project Duration).
The Agile indicator will be computed only if the Project uses the Agile approach.
The value is the comparison between the Project Projected Finish Date and the Project Finish Date.
The Phases & Gates indicator will be computed only if the Project uses the Phases & Gates feature available in the Work workspace, Phases & Gates tab.
The value is the OTD % value as to say the number of Gates On Time as opposed to the total number of Gates.
The CCPM value will be computed only if the Project uses the Critical Chain Schedule Method.
The value is the comparison between the percentage of completion of the Critical Chain (% CC Complete) and the percentage of incursion of the Project buffer (% Buffer Incursion).
The Cost Score is calculated based Effort and Baseline gap values, as well as Billing and Savings values.
The Cost Score value can be made up of 4 Cost Indicators:
Baseline Gap
Budget Gap
Billing
Savings
Cost Score value = 100 - ((Baseline gap value + Budget gap value + (100 - Billing value) + (100 - Savings value)) / (Number of Cost Indicators))
Example:
Let's imagine a project with the following 3 Cost Indicators:
Baseline Gap: 14%
Budget Gap: 10%
Savings value: 20%
The Cost Score value will be 66.
Cost Score = 100 - ((14 + 10 + (100 – 20)) / 3) = 66
The Baseline gap values will be computed only if a Project Baseline has been saved.
Note that if you have saved multiple baselines, Sciforma will take into account the Current Baseline.
The value corresponds to the average of the Effort Baseline Gap and Cost Baseline Gap values, where:
Baseline Effort Gap: Comparison between the Total Labor Effort and the Current Baseline Effort.
Cost Baseline Gap: Comparison between the Total Cost and the Current Baseline Cost.
The Budget gap value will depend on whether or not the Forecast feature is used.
If the Forecast feature is not used, the Budget gap value corresponds to the Comparison between the Project Total Cost and the Project Budget Cost.
If the Forecast feature is used, the Budget gap value corresponds to the Comparison between the Project Forecast Cost and the Budget Cost.
The Billing value will be computed only if the Billing feature has been set up.
The Billing value corresponds to the Project Margin.
The Quality Score is calculated based upon Planning, Resources and Transactions problems as well as Status Report, Work Items, Agile indicators, and Strategy indicators.
The Quality Score value can be made up of 5 Quality Indicators:
Status Report value
Problems value
Work Objects value
Agile value
Objective Health value
Quality Score value = 100 - ((100 – Status Report value) + (100 – Problems value) + (100 – Work Objects value) + (100 – Agile value) + Objective Health value) / (Number of Quality Indicators))
Example:
Let's imagine a project with the following 2 Quality Indicators:
Work Objects value: 25%
Problems value: 67%
The Quality Score value will be 46.
Quality Score = 100 – ((100 – 25) + (100 – 67)) / 2) = 46
The Status Report value will be computed only if a Status Report has been submitted.
Note that if you have submitted multiple Status Reports, Sciforma will take into account the latest one.
The value corresponds to the Total of the Status Report Indicators values divided by the Total Number of Status Report Indicators.
The values of the Status Report Indicators are defined as follows:
For Time, Cost, and Scope indicators:
Red = 0
Orange = 50
Green = 100
For Trend indicators:
Red = 0
Grey = 50
Green = 100
For example:
If you have the following Status Report Indicators, the Quality Score value will equal 62%.

The Quality Score = (100+50+100+0)/4 = 62%
The Problems value is the Average score of the Planning, Resources, and Transactions problems, where:
Planning problems score = Number of tasks with at least one problem / total number of tasks.
Resource problems score = Sum of the Assignments and Resource Acquisition problems (Dedicated, Allocated, and/or Committed).
For Labor Assignments, the following will be taken into account: Number of resources with problems / number of resources assigned.
For Dedicated, Allocated, or Committed Resources, the Assignments outside boundaries will be taken into account (i.e. number of resources with problems / number of Allocated, Dedicated, or Committed resources).
Transactions problems score = Number of “opened” (Forecast or Committed) Transactions in the past / total number of transactions.
Once a task is completed, it is important to mark it as closed, so that the task will not be displayed as having a problem.
The Work Objects value can take into account the following Work Items: Actions, Issues, Deliverables, Change Requests, and Risks.
To be taken into account, each Work item feature must be activated.
The Work Objects value is the Average of the Issue Score, Risk Score, (100 – Deliverable Score), (100 – Action Score), and (100 – Change Request Score) values.
Issue Score: Number of Completed Issues as opposed to the total number of Issues.
Risk Score: Number of Completed Risks as opposed to the total number of Risks.
Deliverable Score: Number of non Completed Deliverables whose Due Date is in the past, as opposed to the total number of Deliverables.
Action Score: Number of non Completed Actions whose Due Date is in the past, as opposed to the total number of Actions.
Change Request Score: Number of non Completed Change Requests whose Due Date is in the past, as opposed to the total number of Change Requests.
The Agile indicators will be computed only if the Project uses the Agile approach.
The Agile value corresponds to the Defect Removal Efficiency (DRE), which is calculated as follows: number of Completed Backlog Items whose Type is “Issue” or “Defect” as opposed to the total number of Backlog Items whose Type is “Issue” or “Defect”.
The Objective Health value will be computed only if the Strategy and Benefits management feature is activated.
The Objective Health may take one of the following values: Good, Must Improve and Not Good.
The Objective Health value is the comparison between the "Expected Target Progress" (ExTP) and the Current value.
To evaluate the ExTP value, two options may be considered:
Distributed values: the expected Target value will be the sum of the Target values over the past periods.
Lump Sum values: based on a projected trend between Start and Finish dates.