Take a tour of all workspaces and views related to this topic.
The Theater mode ( ) available in the Work workspace, Gantt tab, allows users to customize their projects by applying filters before previewing the projects and displaying them in full screen.
This view provides a powerful presentation capability when displaying information to team members, sponsors, customers, and stakeholders.
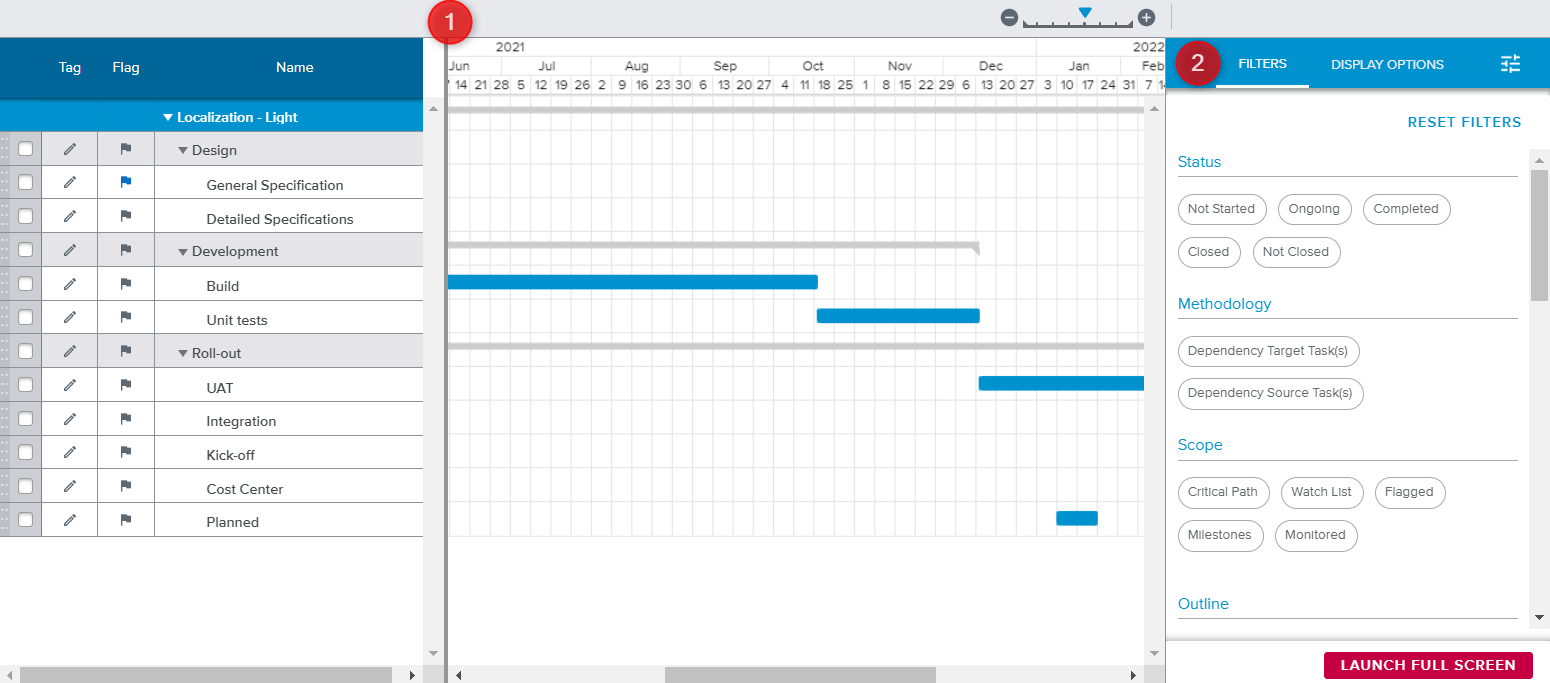
The Customization view is made up of two panels:
The Gantt view, which allows the user to flag and tag tasks, as well as to preview the impact of the selected filters.
The Filtering and Display Options side panel, which allows the user to select the data that should be displayed in full screen mode, which includes a Presets feature allowing the user to save both filters and display options and load them to be applied later or to other projects.
The Gantt view available in the Theater mode provides a simplified version of the toolbar, spreadsheet, and graphic pane available in the Gantt tab, Scheduler mode.
Toolbar
Upon clicking on the More ( ) button (available when selecting at least one task in the spreadsheet), the following commands are available:
Flag Tasks | Marks all the selected tasks as Flagged. |
Remove Flags | Marks all the selected tasks as unflagged. |
Tag Tasks | Prompts the Tags dialog box, allowing the user to create new project tags and assign them to the selected task(s). |
Remove Tags | Removes the tags previously assigned to the selected task(s). |
Spreadsheet
In addition to the Name of the project and task, the spreadsheet provides the following tools:
 | Tag | Prompts the Tags dialog box, allowing the user to create new project tags and assign them to the selected task(s). |
 | Flag | Indicates whether or not the task is flagged. Upon clicking on it, the user can flag or unflag the task. |
Graphic pane
The display of the information available in the graphic pane will differ depending on whether or not the corresponding options available in the Display Options panel are activated.
The Gantt chart legend is the following:
Information | Corresponding Display |
|---|---|
Task on Critical Chain |  |
Parent Task |  |
Task with Total Float |
|
Task with Free Float |
|
Task with Negative Float |
|
Start Delay |
|
Completed portion of a task |
|
Task Baseline (Current Baseline) |
|
Milestone Baseline (Current Baseline) |
|
As of Date |
|


The Filters panel provides the same filtering option as the Gantt Filter dialog box.
It provides a “Reset Filters” button, allowing the user to clear all the filter sections at once.
The following filters can be available:
Task Tags section | |
The Task Tags category allows the user to only display tasks to which a specific tag has been assigned. | |
Status section | |
Not Started | If activated, only tasks with a % Completed equal to zero are displayed |
Ongoing | If activated, only tasks with a % Completed between zero and 100% are displayed. |
Completed | If activated, only tasks with a % Completed equal to 100% are displayed. |
Closed | If activated, only tasks whose Closed field is activated are displayed. |
Not Closed | If activated, only tasks whose Closed field is deactivated are displayed. |
Methodology section | |
Agile | If activated, only tasks identified as an Agile object (Iteration, Release, or Epic) will be displayed. |
Dependency Target Task(s) | If activated, only tasks which are a Dependency Target are displayed. |
Dependency Source Task(s) | If activated, only tasks which are a Dependency Source are displayed. |
Scope section | |
Critical Path | If activated, only tasks with no positive float are displayed. |
Watch List | If activated, only tasks that have been marked as “watched” are displayed. Tasks can be added to the Watch List in the Task Panel available in the Work workspace, Gantt tab, Scheduler view mode. |
Flagged | If activated, only tasks that have been marked as “flagged” ( |
Milestones | If activated, only tasks with a zero duration are displayed. |
Monitored | If activated, only tasks whose duration is equal to “0” and belonging to the Watch List and tasks whose Workflow has been set to “Gate” will be displayed. |
Work Items | If activated, only tasks with Work Items attached will be displayed. |
Risks | If activated, only tasks with Risks attached will be displayed. |
Critical Chain section | |
Critical Chain | If activated, only tasks belonging to the Critical Chain are displayed. |
Feeding Buffers | If activated, only Feeding Buffers are displayed. |
Project Buffers | If activated, only tasks Project Buffers are displayed. |
Outline section | |
Only Parent | If activated, only tasks with children are displayed. |
Only Elementary | If activated, only tasks without children (non-parent tasks) are displayed. Note: This option is only available in some specific views. |
No Predecessor | If activated, only tasks without a predecessor are displayed. |
Up to Level | If a level (from 1 to 10) is selected, only tasks at that WBS level or above are displayed. |
Chain Task | Upon selecting a task in this field, only tasks belonging to the same chain (i.e., linked) as this task will be displayed. The user can take advantage of the Chain Display Options to choose whether only successors or predecessors should be taken into account for the filtering. Note: When a task has already been selected in the Gantt chart, the user can click on the button located on the right-hand side ( |
Organizations | If activated, only tasks for which the selected Owning Organization has been defined will be displayed. Note: This filter is only available if at least one Task of the project has an Owning Organization defined. |
Assignments section | |
Resources | Only tasks for which the selected resources are assigned are displayed. (Only Resources belonging to the Project Team are available for selection). Note If the Logged-in User is part of the Project Team, the My Tasks ( |
Organizations | Only tasks with at least one labor assignment whose Effective Organization is the same as the selected organizations are displayed. |
Job Classification | Only tasks with at least one labor assignment whose Effective Job Classification is the same as the selected job classifications are displayed. |
Skills | Only tasks with at least one labor assignment whose Effective Skill is the same as the selected skills are displayed. |
Generic Resources | Only tasks for which the selected Generic resources have been assigned are displayed. |
Status | Only tasks with No Assignment or with at least one Soft Assignment are displayed. |
Contract Type | Allows the user to only display Resources whose Contract Type is "External" or "Internal". |
Task Allocation Requests Workflow | Allows the user to only display tasks with at least one Allocation Request whose Workflow State has been selected. |
Time Frame section | |
The Time Frame (Month) category allows the user to set the Start Date and Intervals options; the filter created defines the time frame for which only tasks falling within it are displayed. Note When Start Date is set to “Custom”, the Calendar ( | |
Problems section | |
Delayed task(s) | The task is not completed and the Finish date is later than the Baseline Finish. |
Task(s) with open risk(s) | The task has at least one opened risk. |
Task(s) finished before predecessors | The task finishes before at least one of its predecessors. |
When necessary, Billing and Work Objects problems can be displayed as well. | |


The Presets feature allows each user to save both filters and display options set in the side panel and load them to be applied later or to other projects.
Upon clicking on the Presets button, the following commands are available:
Load preset | Prompts the Manage Presets dialog box, allowing the user to load or delete previously saved presets. |
Save as preset | Prompts the Save as preset dialog box, allowing the user to save the selected filters and display options as presets. |
Reset all values | Allows the user to clear the selected filters and display options at once. |
The Display Options allow project managers to decide which data they want to hide and which data they want to highlight and display once the Full Screen mode is launched.
The following options can be activated to include the corresponding information:
Floats | If activated, the floats of the tasks are displayed. |
Dates | If selected, the tasks Finish dates are displayed on the right-hand side of the Gantt bars. |
Critical Path | If activated, the Gantt bars of tasks on the critical path are displayed in red. Otherwise, they are presented in blue. This option is only available for projects whose Schedule Method is set to "Critical Path". |
Critical Chain | If activated, the Gantt bars of tasks on the critical chain are displayed in red. Otherwise, they are presented in blue. This option is only available for projects whose Schedule Method is set to "Critical Chain". |
Dependencies | If activated, a blue line above the Gantt bar will be displayed for tasks which have some dependencies. |
Completion | If activated, the % Completed values appear in green on the Gantt bars of the tasks. Otherwise, the completed durations are hidden, and the overall durations of the tasks are displayed in blue. |
Links | If activated, the predecessor-successor links are displayed between the Gantt bars of the tasks. |
Baseline | If activated, the Baseline Duration values are shown underneath the Gantt bars. Otherwise, they are hidden. Upon activating this switch button, the Baseline pick-list is displayed, allowing the user to choose which Baseline needs to be taken into account. |
Tag Colors | If activated, tasks that have been tagged will be displayed in the color defined by the tag. |
The user can take advantage of the "Select All" and "Clear All" buttons available in the upper section of the panel to switch on or off all the options listed above.
The Task Drill Down Panel switch button allows users to display task details on the right-hand side of the Gantt chart when in the Full Screen mode. When activated, clicking on a task while in Full Screen mode displays a Task Panel showing information about the task selected.
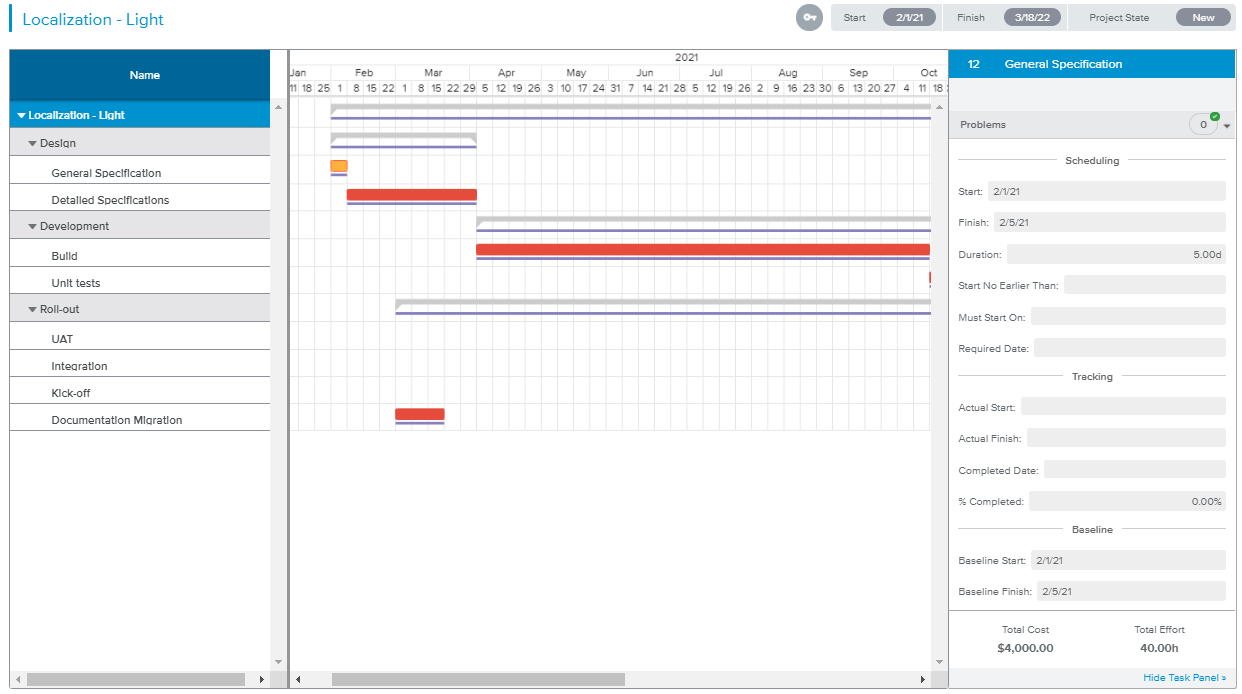
The Full Screen view displays a popup spanning the entire screen, showing only a Gantt chart similar to the one displayed during the Customization step.
The user can take advantage of the "Export to…" command available upon clicking on the interactive Gear ( ) button, to print the customized Gantt chart for sharing.
In the upper right corner, the Key Facts section provides the following information: Project Start date, Project Finish date, and Project Workflow State.
If the Task Drill Down Panel option, available in the Display Options side panel of the Customization step, has been activated, the following occurs upon clicking on a task:
A read-only Task Panel appears to show information about the selected task.
The Gantt bar of the selected task is displayed in orange, except if the task is 100% completed and the Gantt chart is configured to display task completion (the Completion option in the Customization step has been turned on), in which case the Gantt bar is displayed in green.
In the bottom right corner, the Hide Task Panel label, is available for closing the Task Panel without leaving the Full Screen mode.
When using the Full Screen mode (and the Task Drill Down option has been turned on), clicking on the project name displays a project-level view.
To exit the Full Screen view, the user must use the keyboard and press the Esc key, exactly like what one would do when using the presentation mode of a slide show.