The Project Information panel is located on the left-hand side of the view and displays all the key information regarding the selected project.
The panel can be displayed or hidden using the following buttons:
 | Show | Allows the user to display the panel. |
 | Close | Allows the user to hide the panel. |
The following project Key Facts are provided:
Epics | Indicates the number of completed Epics as opposed to the total number of Epics for the selected project. |
Iterations | Indicates the number of completed Iterations as opposed to the total number of Iterations for the selected project. |
Releases | Indicates the number of completed Releases as opposed to the total number of Releases for the selected project. |
Epics, Iterations, and Releases can be created in the Project Structure full screen view.
The project progress indicators are then displayed:
 | Project Backlog Items | Provides the % Completed, the corresponding progress bar, the number of Completed Backlog Items, and the total number of Backlog Items. |
 | Project Story Points | Provides the % Completed, the corresponding progress bar, the number of completed Story Points, and the total number of Story Points. |
In the How’s the project doing? section, the user will find the following information: Remaining Issues & Defects, Defect Removal Efficiency, Average Velocity, Cycle Time, and the Projected Finish Date.
The Iterations section provides a list of the selected project Iterations. Each Iteration is displayed in the form of a card.
Upon clicking on the “Only” label of the card, only the Backlog Items belonging to the corresponding Iteration will be displayed in the Backlog Items spreadsheet.
The user can also take advantage of the Add as filter option (available upon clicking on the More ( ) icon) or the Filters popup to display information regarding several Iterations at once.
The “Remove” label is then made available in the card, allowing the user to remove the corresponding filter.
Upon clicking on the card’s More () icon, the following options are available:
Add as filter | Allows the user to add the corresponding Iteration in the Iterations field of the Filters popup. |
Edit | Opens the Iteration dialog box, allowing the user to modify the information for the corresponding Iteration. |
The Assignees section displays the list of users assigned to the selected project Backlog Items. Each Assignee is represented by a card featuring the User Name.
Upon clicking on the “Only” label of the card, only the Backlog Items whose Assignee is the selected User will be displayed in the Backlog Items spreadsheet.
The user can also use the Add as filter option (available upon clicking on the More () icon) or the Filters popup to display information regarding several Team Members at once.
The “Remove” label is then made available in the card, allowing the user to remove the corresponding filter.
The Epics section displays the list of Epics for the selected project. Each Epic is represented by a card featuring the Epic Name.
Upon clicking on the “Only” label of the Epic card, only the Backlog Items belonging to the corresponding Epic will be displayed in the Backlog Items spreadsheet.
The user can also use the Add as filter option (available upon clicking on the More () icon) or the Filters popup to display information regarding several Epics at once.
The “Remove” label is then made available in the card, allowing the user to remove the corresponding filter.
Upon clicking on the card’s More () icon, the following options become available:
Add as filter | Allows the user to add the corresponding Epic in the Epics field of the Filters popup. |
Edit | Opens the Epic dialog box, allowing the user to modify the information for the corresponding Epic. |
The Backlog tab provides a spreadsheet, allowing users to quickly browse through the backlog items of the selected project.
The attributes available will differ depending on the selected Display Option ( ).
).
Upon clicking on the Details ( ) button for a Backlog Item, a read-only version of the Backlog Item dialog box is displayed.
The main toolbar provides the following options:
 | Enable Filters | Allows the user to access the Filters popup, in which all the Filtering Options are available. |
Quick Filters | This series of chips allows the user to only display the Backlog Items that fit the selected options: “Unassigned” and “Accepted”. | |
 | Show Completed | Includes the Backlog Items whose Workflow State is “Completed”. |
 | Sort By | Allows the user to sort the Backlog Items by Business Value, Due Date, Priority, Story Points, or Key (default). |
| Display Options | Allows the user to only display specific Backlog Item attributes. The following options are available:
|
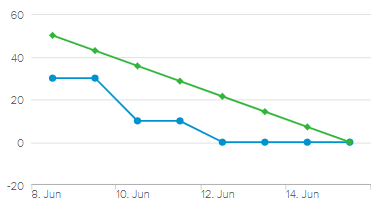
The Burn Down chart compares the remaining hours the team(s) need to complete against the ideal burndown.
When no Iteration is selected in the Project Information panel, the Burn Down Chart displays the Project Burndown.
The X-axis displays the iterations, and for each of these iterations, a green point will show the Total Points of the Project Backlog as of the finish date of the iteration, whereas a blue point shows the Remaining Points as of the finish date (i.e., Completed Date < Iteration Finish date).
The user can take advantage of the Show Completed Iterations Only () display option for the chart to only take into account Iteration whose Workflow State is "Completed".
When an Iteration has been selected in the Project Information panel, the Burn Down Chart sub-tab displays the Iteration Burndown, which shows the trend of the Remaining Points (i.e., how they decrease as the iteration progresses) as opposed to the Guideline (i.e., ideal progression of the Remaining Points over time to complete the Iteration on time).
The Completed Date of the Backlog Item (automatically logged upon completing the item) is considered when calculating the Iteration Burn Down Chart. For the Burn chart to be displayed properly, the Completed Date must be earlier than or equal to the Iteration Finish Date.
The Burn Up chart compares the story points the team completed against the ideal progression.
When no Iteration is selected in the Project Information panel, the Burn Up Chart displays the Project Burnup.
The X-axis displays the iterations, and for each of these iterations, a green point will show the Total Points of the Project Backlog as of the finish date of the iteration, whereas a blue point shows the Points done as of the finish date (i.e., Completed Date < Iteration Finish date).
The user can take advantage of the Show Completed Iterations Only () display option for the chart to only take into account Iteration whose Workflow State is "Completed".
When an Iteration has been selected in the Project Information panel, the Burn Up Chart sub-tab displays the Iteration Burnup, which shows the trend of the Points done (i.e., how they increase as the iteration progresses) as opposed to the Guideline (i.e., ideal progression of the Points done over time to complete the Iteration on time).
The Completed Date of the Backlog Item (automatically logged upon completing the item) is considered when calculating the Iteration Burn Up Chart. For the Burn chart to be displayed properly, the Completed Date must be earlier than or equal to the Iteration Finish Date.
The velocity report tracks the story points completed within a specified timeframe by comparing the Baseline Points with the number of points for the delivered Backlog Items. Accessing it enables team members to determine how well they are able to meet the schedule timeline and allows them to measure their performance over time.
The Epic dashboard gives the user an idea of the feature breakdown of the product (i.e., Epics).
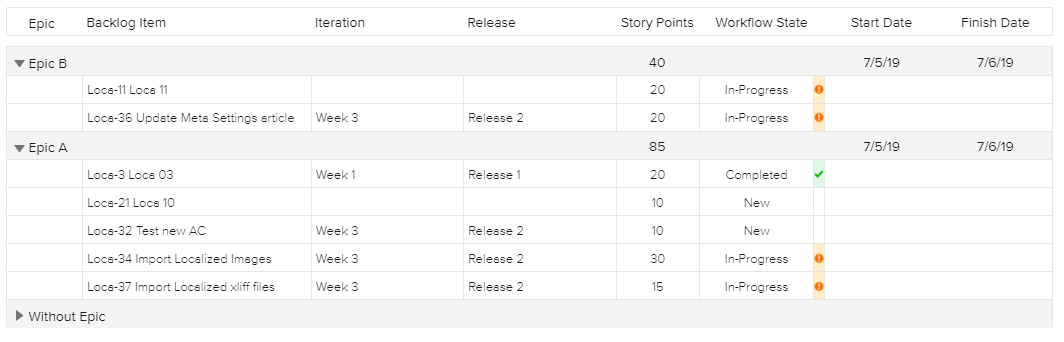
It shows the backlog items related to each epic and provides detailed Information about the Iteration, Release, Story Points, Workflow State, Start Date, and Finish Date.
The user can take advantage of the Workflow States filter provided in the main toolbar to only display the Backlog Items whose Workflow State has been selected.
The Release tab provides a list of Backlog Items sorted by Releases.
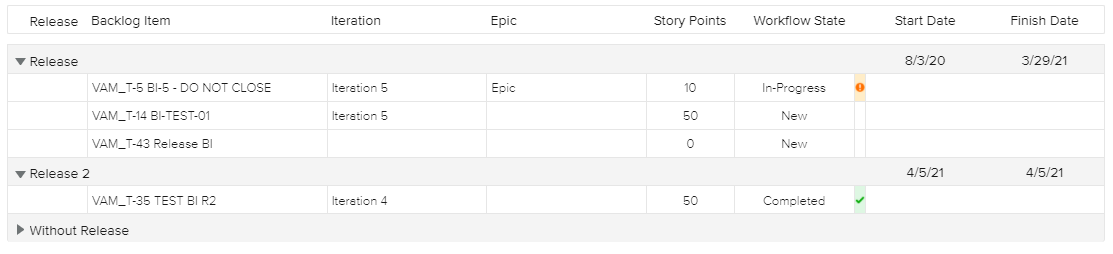
The following Backlog Item attributes are available: Name, Iteration, Epic, Story Points, Workflow State, Start Date, and Finish Date.
The user can take advantage of the Workflow States filter provided in the main toolbar to only display the Backlog Items whose Workflow State has been selected.
The Team dashboard is meant to provide information about the Project team as defined in the Project Structure full screen view, Teams tab.
Users who have been assigned to Backlog Items but have not been defined as Team Members will not be taken into account in this dashboard.
The Team dashboard allows users to compare for each resource the effort resulting from the Agile Activity Logs (Actual Effort and Remaining Effort) and the effort from any other views assignments.
Upon activating the Show Charts ( ) display option, a graph is displayed, providing the following information for each Team Member: Remaining Effort, Actual Effort, and Total Effort (Assignment).
The user can decide to display the spreadsheet data as well as the chart in terms of Story Points by using the corresponding display option ( ).
).
The Activity Log tab allows the user to review the entered Agile Activity Logs for the selected project.
The spreadsheet information differs depending on the selected Group By ( ) display option:
Backlog Item (default) | Indicates the detailed Actual Effort, Estimated Effort, Remaining Effort per Backlog Item, as well as the Backlog Item Workflow State. |
User | Indicates the Actual Effort of each Team Member, with the Date of each Activity Log entry. |
The Activity Stream tab shows the Activity Stream for the last seven days of the selected project.
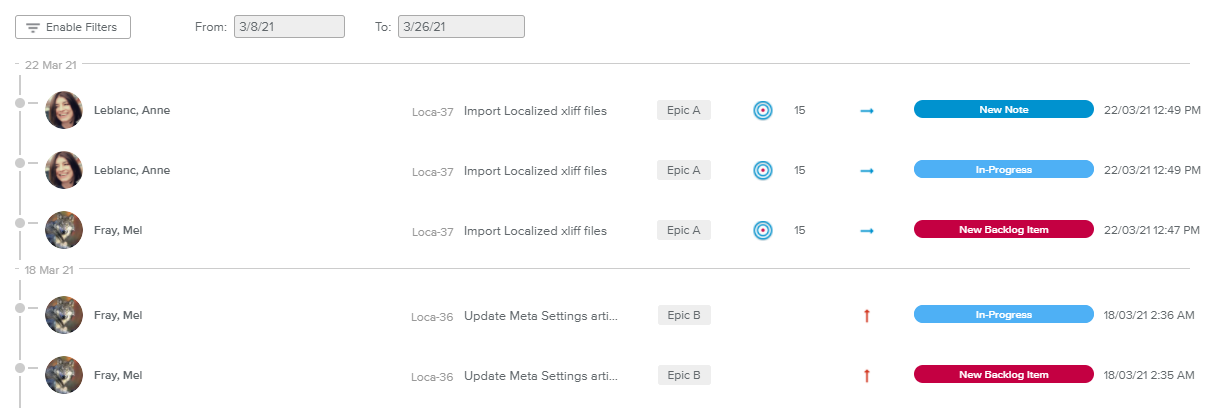
The user can take advantage of the “From” and “To” fields to define a specific time frame.
The following Types of event records are available:
New Backlog Item | Indicates that a new Backlog Item has been created. |
Workflow State | Indicates that a Backlog Item Workflow State has been updated. |
Accepted | Indicates that the Backlog Item has been marked as “Accepted”. |
Notes | Indicates that a Note has been added in the Backlog Item dialog box. |
For each Activity Stream entry, the following information is provided: Creator, Backlog Item Key and Name, Epic, Story Points, Priority, Type of event, and Date of the event.
Upon clicking on the Backlog Item name or Key, the corresponding read-only Backlog Item dialog box is displayed.
The Activity Stream tab Filters popup provides the following filtering options:
Team Members | Allows the user to only display Backlog Items whose Assignee is the selected Team Member. |
Iterations | Allows the user to only display the Backlog Items that have been assigned to the selected Iteration(s). |
Releases | Allows the user to only display the Backlog Items that have been associated with the selected Release(s). |
Epics | Allows the user to only display the Backlog Items that have been associated with the selected Epic(s). |
Types | Allows the user to only display the Backlog Items whose Type has been selected. |
Workflow States | Allows the user to only display Backlog Items with the selected Workflow State. |
Type | Allows the user to only display a specific type of event. |
Creator | Allows the user to only display the events whose Creator has been selected. |