The Zoom Controls area allows the user to zoom in and zoom out in the Gantt chart graphic pane. In other words, it sets the time interval (e.g., year, month, week, etc.).
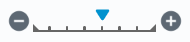
The Zoom Controls area is made up of three components:
 | Zoom Out | Allows the user to go to the next higher interval. |
 | Level of Zoom | Provides an indication of the current interval. |
 | Zoom In | Allows the user to go to the next lower interval. |
Tip
Users can click a tick in the middle section to jump to a corresponding interval.