The Risks tab available in the Project Card provides all the tools needed to manage the Risks of a project. It makes it possible for the user to:
Create and Manage Risks.
Review the Risks Dashboards.
Create and Manage Risk Simulations.
In the case of single project selection, the Home Page is made up of the following sections:
Project Information panel – Provides key project-level information
Risks section – Provides a list of Risks which differs depending on the selected display options.
In order to ensure an all-in-one user experience, this view provides smooth navigation with a series of full screen views.
When in a full screen view, the navigation tools are available in the header and behave as follows:
Back button (left arrow) – Goes back to the previous screen (i.e., the screen from which the current view has been accessed).
Close button (right “X”) – Switches the view to the Home Page.
The Project Information panel is located on the left-hand side of the view and displays key project-level information.
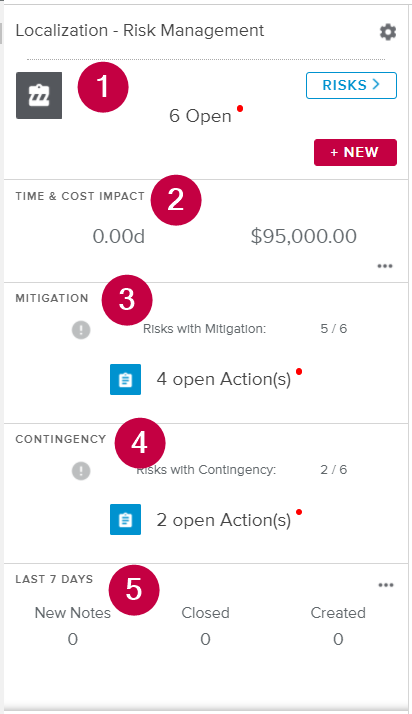 |
The Project Information panel is made up of the following sections:
Project Risks section
Time & Cost Impact section
Mitigation section
Contingency section
Activity Stream section
The Header displays the project Name and a Gear ( ) icon that provides access to the Risks Advanced Attributes popup where users can update the Risks key.
The Project Risks section provides a way to easily review and manage the Risks, as well as facilitating the navigation between the Home Page and the Full Screen views:
 | Displays the Risks full screen view, with the filtering options that were previously set retained. |
 | Displays the Risks full screen view, with the left panel featuring the Filters section, and the Show Closed ( Note A red dot will be displayed if at least one Risk features one of the following alerts: Overdue, Planned beyond Due Date, and Estimated in the Past. |
 | Opens the Risk dialog box, allowing the user to create a new Risk. |
The Time & Cost Impact section provides the following information:
Time – Sum of the Impact Time values of all the Risks related to critical Tasks
Cost – Sum of the Cost Impact values of all the Risks
Upon clicking on the More ( ) button located in the bottom right corner of the section, the Risks full screen view, Grid tab is displayed.
The Mitigation section allows the user to quickly review the mitigation status of the project.
The following information can be displayed depending on the definition of the Risk Mitigation Plan:
 – None of the Risks have a Mitigation Plan
 – Some Risks have a Mitigation Plan
 – All the Risks have a Mitigation Plan
The Mitigation Plan is considered to be “defined” as soon as the Description field is filled in, or a Mitigation Item or Action has been created.
The number of open Mitigation Actions is displayed as well; it will feature red dot as soon as at least one Mitigation Action encounters one of the following alerts: Overdue, Planned beyond Due Date, or Estimated in the Past.
The Contingency section allows the user to quickly review the contingency status of the project.
The following information can be displayed depending on the definition of the Risk Contingency Plan:
- – None of the Risks have a Contingency Plan
- – Some Risks have a Contingency Plan
- – All the Risks have a Contingency Plan
The Contingency Plan is considered to be “defined” as soon as the Description field is filled in, or a Contingency Item or Action has been created.
The number of open Contingency Actions is displayed as well; it will feature a red dot as soon as at least one Contingency Action encounters one of the following alerts: Overdue, Planned beyond Due Date, or Estimated in the Past.
Clicking on the open Contingency Actions value opens the Actions full screen view.
The Last 7 Days section provides the following statistics: number of new Notes, number of Risks closed, and number of new Risks.
Upon clicking on the More () button located in the bottom right corner of the section, the view will switch to the Dashboards full screen view, Activity Stream tab, where the entire Activity Stream is available.
The Specific Views section provides the following buttons:
 | Opens the Dashboards full screen view. |
 | Opens the Risk simulation full screen view. |
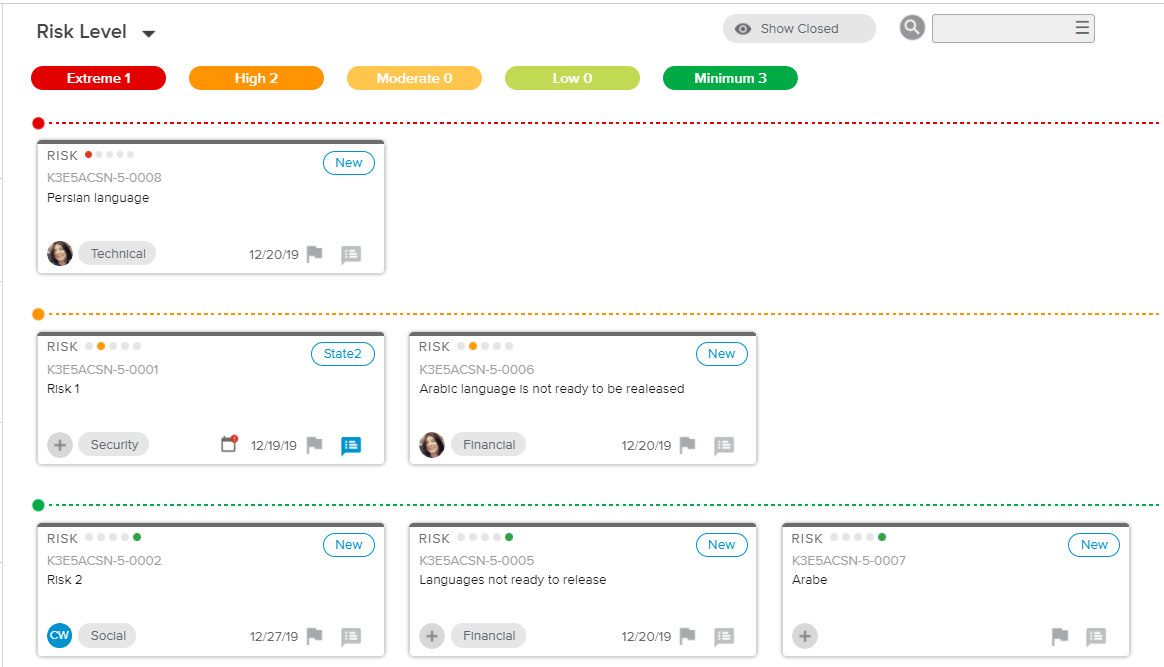
The Risks section provides a list of the selected project Risks in the form of cards.
 |
When the cards are grouped by Tasks (Timeline display), each Task container will provide the following Task attributes: #, Name, Parent (if any), Start, and Finish.
When some Actions are connected to a Risk, they will be displayed in the Risks view as well (in Recently Updated display only).
Each Risk is displayed in the form of a Risk card.
The Risks displayed will differ depending on the option selected in the pick-list located in the upper left corner:
Risk Level (default) – Allows the user to display all the selected project Risks, sorted by Risk Level. The number of Risks per Risk level is indicated in the colored chips at the top of the view.
Timeline – Allows the user only to display the Risks whose Estimated Date falls between the beginning of the previous month and the end of the next month. When selecting this option, the view will group the risks by the Related Task.
Recently Updated – Allows the user to only display the Risks that have been updated between Today’s date and Today’s date + Alert Granularity value. The following events are considered as updates: Workflow State update, Risk creation, moved Risk, and new Note.
In addition, the Show Closed ( ) display option allows the user to display the Risks that have reached their final Workflow State.
Finally a Search ( ) option allows the user to filter Risk cards by searching for a Risk Name, a Parent Name, or a Key.