The Agile tab provides all the tools needed to manage the Agile features of a project. The Agile views make it possible for the user to:
Define the Product Backlog.
Define the product roadmap (Iterations and Releases dates).
Define Epics and organize their outline.
Define the Product Development Teams.
Manage and update Iterations and Backlog Items.
Review the Agile Dashboards.
The Project Information panel is located on the left-hand side of the view and displays all the key information regarding the selected project.
The Header displays the project Name and a gear ( ) icon.
Upon clicking on the Gear icon, the Agile Advanced Attributes popup is displayed.
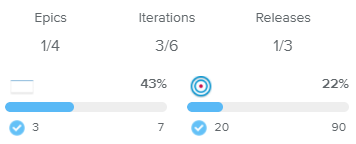
The following Key Facts are provided:
Epics | Indicates the number of completed Epics as opposed to the total number of Epics for the selected project. |
Iterations | Indicates the number of completed Iterations as opposed to the total number of Iterations for the selected project. |
Releases | Indicates the number of completed Releases as opposed to the total number of Releases for the selected project. |
Epics, Iterations, and Releases can be created in the Project Structure full screen view.
The project progress indicators are then displayed:
 | Project Backlog Items | Provides the % Completed, the corresponding progress bar, the number of Completed Backlog Items, and the total number of Backlog Items. |
 | Project Story Points | Provides the % Completed, the corresponding progress bar, the number of completed Story Points, and the total number of Story Points. |
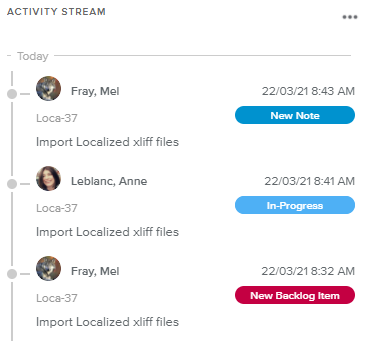
The Activity Stream section will only display events (i.e., Backlog Item creation, Workflow State update, and any new Note) occurring on Today’s date or the day before.
Upon clicking on the More ( ) button located in the upper right corner of the section, the user can access the full Activity Stream tab available in the Project Dashboards full screen view.
Each entry provides the following information: Creator, Creation Date, Backlog Item Key and Name, as well as the type of event.
Upon clicking on the Backlog Item name or Key, the corresponding Backlog Item dialog box is displayed.
The following labels are provided at the bottom of the panel to access the corresponding detailed views:
Backlog | Provides access to the Full Backlog full screen view, allowing the users to create and manage all the product Backlog Items. This label is only available if at least one Backlog Item has been created. |
Structure | Provides access to the Project Structure full screen view, allowing the user to define the project’s Iterations, Releases, Epics, and Teams. |
Dashboards | Provides access to the Project Dashboards full screen view. This label is only available if at least one Backlog Item has been created. |
The Timeline section is located at the top of the view and allows the user to keep track of the current, previous, and upcoming Iterations for the project.
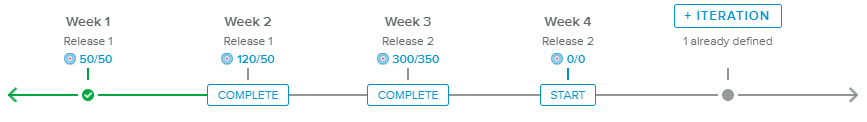
The Timeline section displays up to four Iterations with the following information: Name, Release, and Story Points (Assigned Points/Iteration Budget Points).
Clicking on the Iteration Name will open the Iteration Details full screen view. If the Iteration Workflow State is “New”, the Backlog tab will be specifically displayed, with the “Build Mode” activated.
Depending on the number of Started Iterations, the timeline will show the following information:
No Current Iteration | Two last completed Iterations (if any) and the ones that follow next |
One Current Iteration | Two last completed Iterations (if any), the current one, and the ones that follow next |
Several Started Iteration | The last completed Iteration, the started ones, and the one that follows (if an Iteration slot is still available) |
The “Already Defined” value indicates the number of additional planned Iterations (i.e., Iterations not displayed in the Timeline).
The user can perform the following actions from the Timeline:
Add Iteration | Opens the Iteration dialog box, allowing the user to create a new Iteration. |
Complete Iteration | Allows the user to change the Iteration Workflow State Vote to “Completed”. If some Iteration Backlog Items are still open, the user will be prompted to choose whether they should be moved to the Project Backlog or another Iteration. |
Start Iteration | Allows the user to change the Iteration Workflow State Vote to “Started”. This action is only possible if there are no other “Started” Iterations with the same Team. |
The Current Iteration view will be displayed when there is only one Iteration whose Workflow State is “Started”.
The following Alerts are available in the upper part of the view:
Assigned Points correspond to the Baseline.
Assigned Points are under Baseline by: XX%.
Assigned Points are over Baseline by: XX%.
Assigned Points correspond to the Budget.
There are no Assigned Points defined.
Assigned Points are under Budget by: XX%.
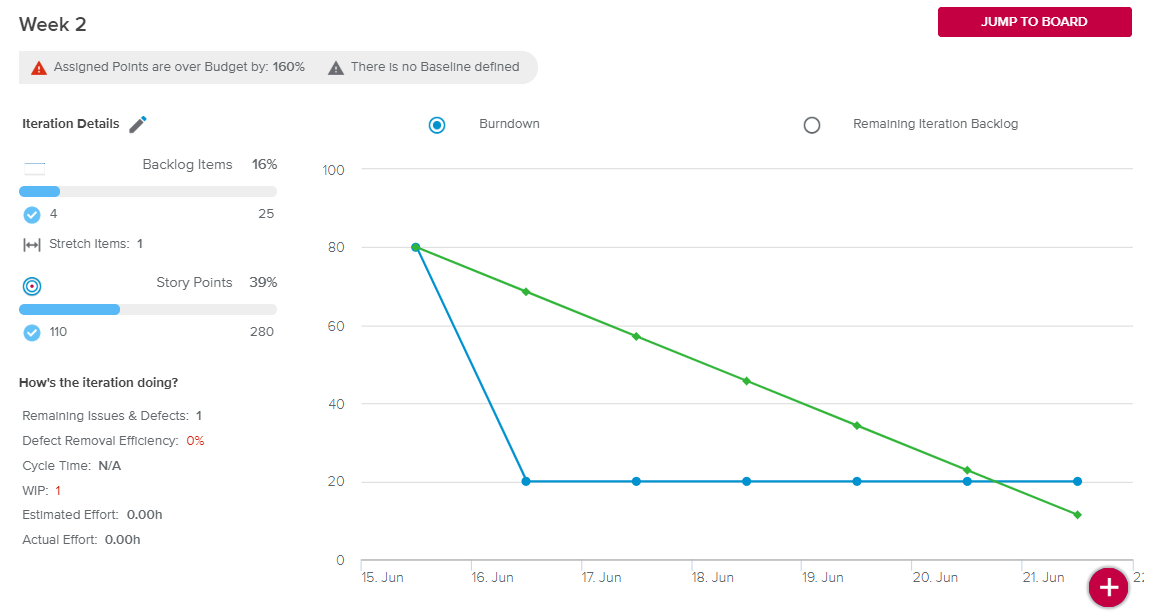
Assigned Points are over Budget by: XX%.
There is no Baseline defined.
The warning colors are defined by the Administrator in the System Settings workspace, General Settings folder, Colored Indicators tab, Agile Warnings Preferences.
Upon clicking on the Jump to Board button, the Iteration Details full screen view, Board tab is displayed.
The Iteration Details section provides the following information:
| Iteration Backlog Items | Provides the % Completed, the corresponding progress bar, the number of Completed Backlog Items, the total number of Backlog Items, and the number of Stretch Items. |
| Iteration Story Points | Provides the % Completed, the corresponding progress bar, the number of completed Story Points, and the total number of Story Points. |
Upon clicking on the Edit ( ) button, the Iteration dialog box is displayed with more detailed information regarding the Iteration.
In the How’s the Iteration doing? section, the user will find the following information: Remaining Issues & Defects, Defect Removal Efficiency, Cycle Time, WIP, Estimated Effort, and Actual Effort.
The Iteration Burndown Chart, available when the corresponding radio button is selected, shows the trend of the Remaining Points (i.e., how they decrease as the iteration progresses) as opposed to the Guideline (i.e., ideal progression of the Remaining Points over time to complete the Iteration on time).
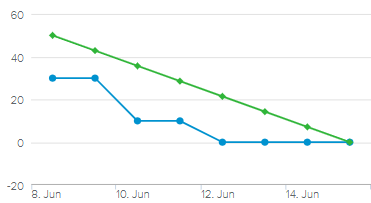
The Burndown chart values can also be displayed in Effort rather than in Story Points depending on the “Burndown Data” option selected in the Agile Advanced Attributes popup.
The Burnup chart can be displayed instead of the Burndown depending on the Performance Chart option defined in the Agile Advanced Attributes popup.
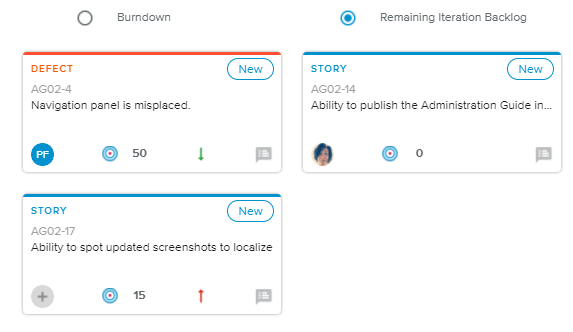
The Remaining Iteration Backlog section, available when the corresponding radio button is selected, displays the remaining Backlog Items of the Iteration (i.e., non Completed Backlog Items assigned to the Iteration). Each Backlog Item is displayed in the form of a Backlog Item card.
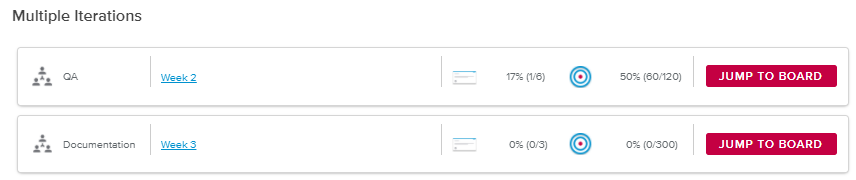
When several Iterations are ongoing at the same time, a recapitulative view will be displayed, with each Iteration represented by a card having the following information: Team, Name, % Completed (Backlog Items), % Completed (Story Points), and the Jump to Board button to access the corresponding Iteration Details full screen view, Board tab.
Upon clicking on the floating Add ( ) button, the Backlog Item dialog box is displayed.
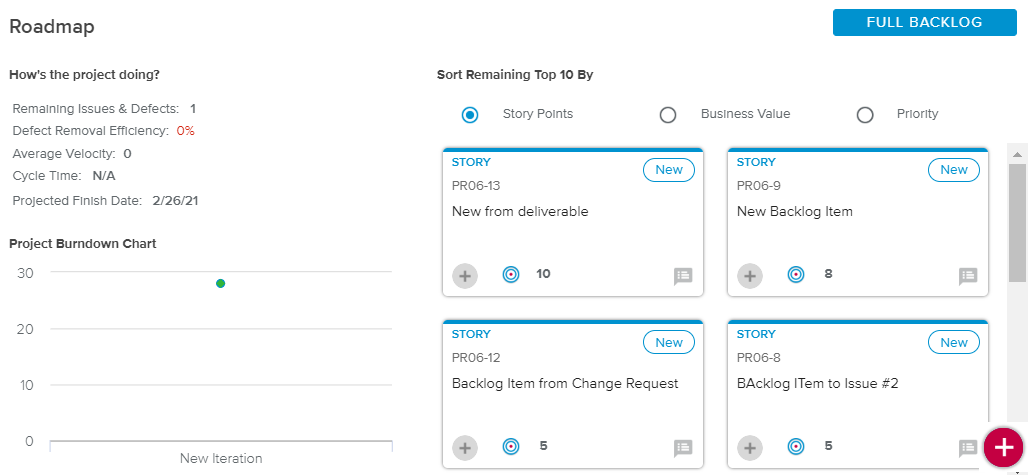
In the How’s the project doing? section, the user will find the following information: Remaining Issues & Defects, Defect Removal Efficiency, Average Velocity, Cycle Time, and Projected Finish Date.
In the project’s Burndown Chart section, the X-axis shows the iterations, and for each of these iterations, a green point will show the Total Points of the Project Backlog as of the Finish date of the iteration. Another blue point will show the Remaining Points as of the Finish date (i.e., Completed Date < Iteration Finish date).
The Remaining Top 10 by section shows ten Remaining Backlog Items, sorted (descending order) by either Story Points, Business Value, or Priority depending on the selected option.
The following actions are possible:
Full Backlog | Upon clicking on this button (located in the top right corner of the view), the Full Backlog full screen view is displayed. | |
| Add Backlog Item | Upon clicking on this floating button located in the bottom right corner of the view, the Backlog Item dialog box is displayed. |
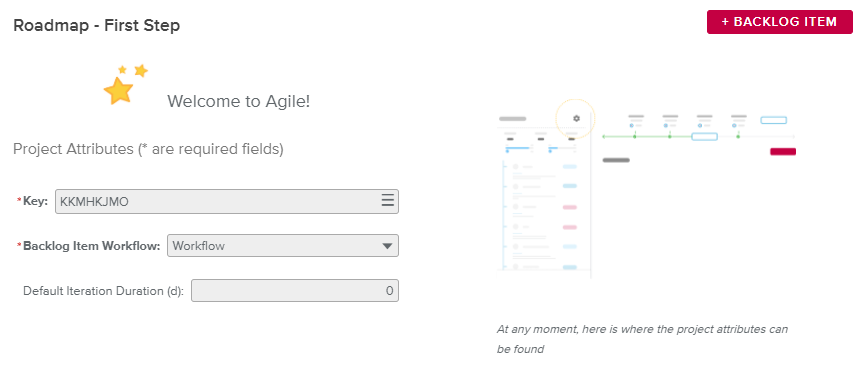
When accessing the Agile tab for the first time, an empty state is displayed allowing the user to define the Agile project:
The user first enters the project Agile Attributes (main section).
Once the mandatory attributes are entered, the “Add Backlog Item” button becomes available, providing access to the Backlog Item dialog box. Upon doing so, the Backlog label becomes available in the bottom of the Project Information panel.
In the Project Information panel (left-hand side), the user is also invited to create the project Structure.
The Agile attributes will be available at all times in the Agile Advanced Attributes popup, displayed upon clicking on the Gear () icon located in the upper right corner of the Project Information panel.
The Overview mode ( ) displays the Agile information for each project will be presented in the form of a card.
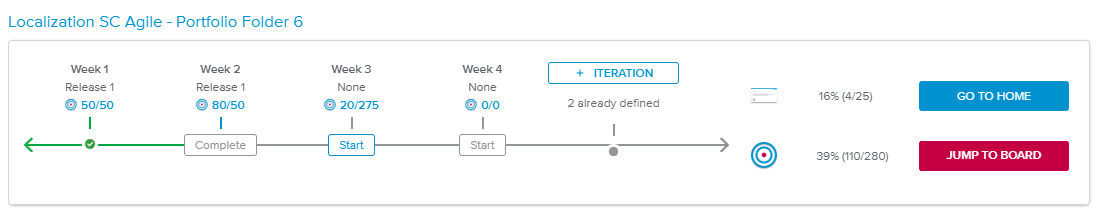
The card provides a timeline, which displays the following Iteration attributes: Name, Release, Story Points (Assigned Points/Iteration Budget Points), and Workflow State.
The following project information is made available: % Completed (Backlog Items) and % Completed (Story Points).
In addition, the following buttons are displayed:
Go to Home – Removes automatically the multi-selection to focus on the selected project.
Jump to Board – Opens the corresponding project Iteration Details full screen view, Board tab (while keeping the multi-project selection).
The Grid mode ( ) lists all the Backlog Items belonging to the selected projects.
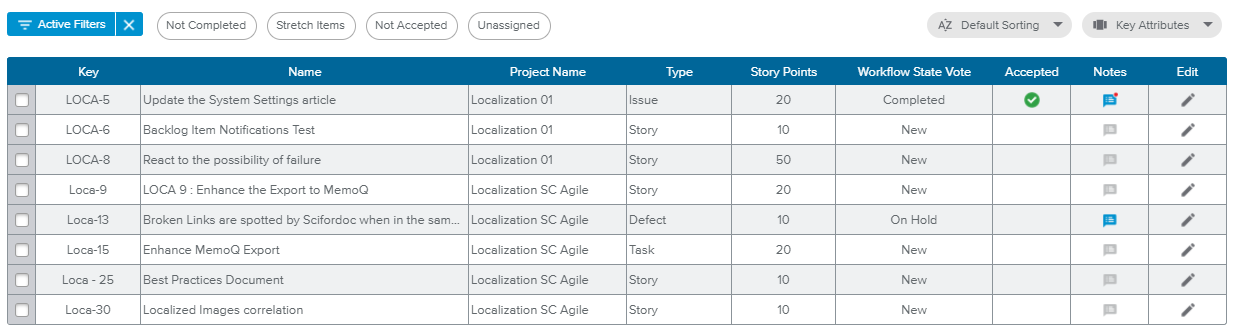
The spreadsheet displays different attributes depending on the selected Display Option ( ) among the following:
Prioritization (default) – Key, Name, Type, Priority, Business Value, Assigned Iteration, Epic, Story Points, Workflow State Vote, and Accepted.
Key Attributes – Key, Name, Type, Workflow State Vote, and Accepted.
Export Only – This view will display the maximum number of columns (it is not meant to be readable, but only to be exported using the spreadsheet Print options).
In addition, the user can also take advantage of the following options:
 | Enable Filters | Allows the user to access the Filters popup, in which all the Filtering Options are available. |
Quick Filters | This series of chips allows the user to only display the Backlog Items that fit the selected options: "Not Completed", "Stretch Items", "Not Accepted", and "Unassigned". | |
 | Sort By | Allows the user to sort the Backlog Items by Business Value, Due Date, Priority, Story Points, or Key (default). |