The Project Allocations tab of the Resources workspace provides relevant information regarding the selected project Allocations and Allocation Requests.
This tab is only available in single-project selection.
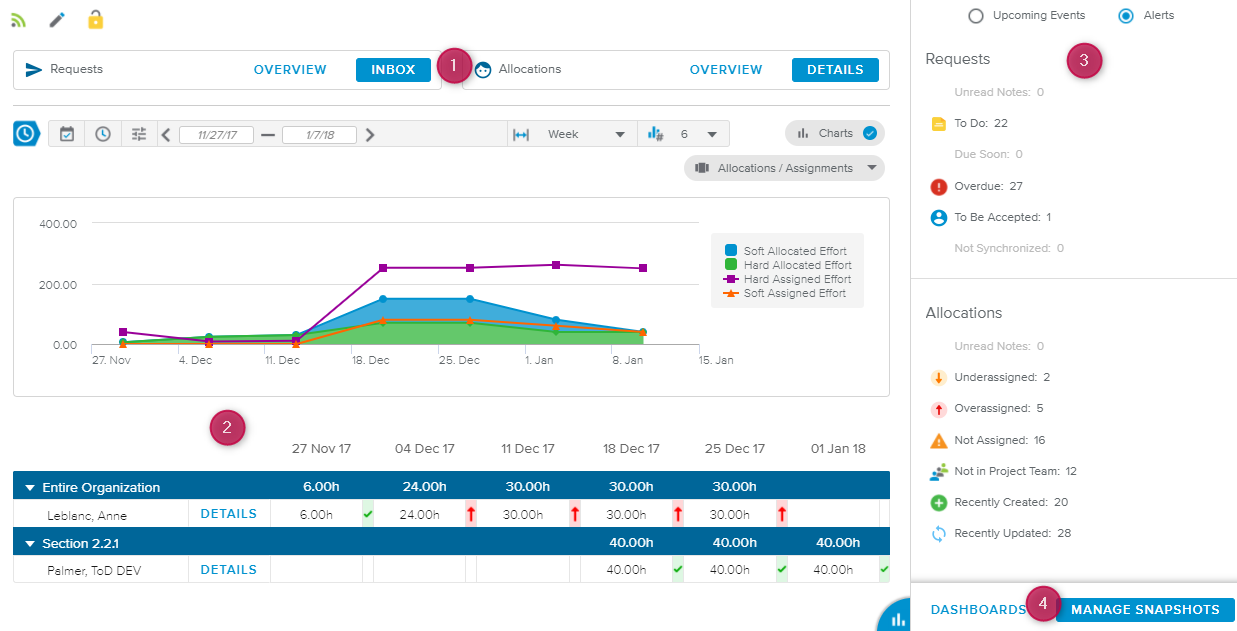
The Project Allocations tab Home Page view is made up of:
The Navigation tiles – Provide quick access to the relevant views in the Project Allocations full screen view.
The Overview view – Shows the general situation in terms of allocations with some charts and a spreadsheet.
The side section – Provides access to the Upcoming Events and Alerts panels.
The Links section – Provides access to the Allocations Dashboards and Snapshots.
The Navigation tiles provide the user with quick access to the Project Allocations full screen view information.

The user can navigate using the tiles as follows:
Clicking on the Overview button of the Requests tile displays the Requests tab, Requests Overview sub-tab.
Clicking on the Inbox button of the Requests tile displays the Requests tab, Requests Inbox sub-tab.
Clicking on the Overview button of the Allocations tile displays the Allocations tab, Resources Overview sub-tab.
Clicking on the Details button of the Allocations tile displays the Allocations tab, Resource Details sub-tab.
Once in the Project Allocations full screen view, the user can navigate in between tabs and sub-tabs as desired.
Clicking on the white Close ( ) button located in the upper right corner of the full screen view takes the user back to the Project Allocations tab Home Page.
The Overview view allows the user to understand at a glance the current state of the project allocations for the selected time period.
The Time Navigation toolbar that is provided impacts both the charts and the spreadsheet, and the Underassigned and Overassigned alerts available in the Alerts panel as well.
The Charts section is available as soon as the Charts ( ) display option (located on the right-hand side of the Time Navigation toolbar) is activated.
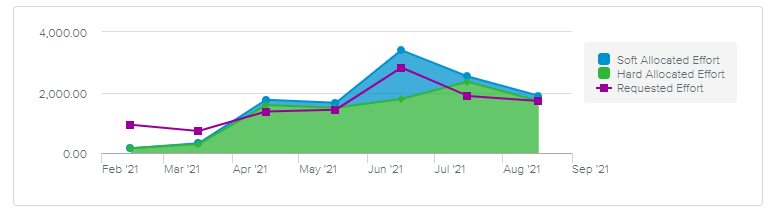
Depending on the display option ( ) selected, the following charts can be displayed:
Requests / Allocations | Allows the user to compare the Soft Allocated Effort, Hard Allocated Effort, and Requested Effort. |
Allocations / Assignments | Allows the user to compare Soft and Hard Allocated Effort with hard and soft Assigned Effort. |
The spreadsheet displays the list of Resources Allocated to the project along with the corresponding Allocated Effort for the selected time period, grouped by Organization.
Colored indicators are provided to highlight the % shift between the Usable Effort and the Total Effort (Assignments). The user can access the legend of the colored indicators by clicking on the Legend ( ) button located in the bottom right corner of the view.
Colored Indicators are defined by the Administrator in the System Settings workspace, General Settings folder, Colored Indicators tab, Resource Utilization Preferences.
Upon clicking on the Details button, the Project Allocations full screen view, Allocations tab, Resource Details sub-tab is displayed, with the corresponding resource made current.
The Upcoming Events panel displays events that are expected to occur in the upcoming period and include the following:
Upcoming non-working days | Provides a list of Resources with at least one non-working day in the upcoming period. |
Allocations starting soon | Provides a list of Allocations whose Start Date (i.e., first date on which the Allocated Effort > 0) falls within the upcoming period. |
Allocations finishing soon | List of Allocations on which the Finish Date (i.e., last date on which the Allocated Effort > 0) falls within the upcoming period. |
The upcoming period considered in the Upcoming Events panel is defined by the Administrator using the “Upcoming Events Granularity (days)” setting available in the System Settings workspace, Resource Settings folder, Allocations & Commitments tab, Allocations Options section.
For each of these event categories, the first ten events are displayed in the form of Resource cards.
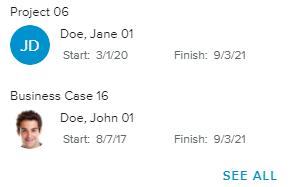
Each card provides the following information:
Project and Task Name (for the Allocations only)
Resource Picture and Name
Allocation Start and Finish dates (i.e., the first and last dates on which the Allocated Effort > 0)
When a Resource has multiple allocations for a given event category, the Resource will be displayed multiple times.
The user can interact with the view as follows:
Clicking on a Resource name displays the Project Allocations full screen view, Allocations tab, Resource Details sub-tab, with the corresponding resource made current.
Clicking on the See All button displays the Project Allocations full screen view, Allocations tab, Resources Overview sub-tab, with the Filters panel open and the filtering option corresponding to the selected event activated.
The Alerts panel provides quantified information the user should be aware of regarding both the Allocations and the Allocation Requests.
When no issues are encountered for a specific alert, it is displayed as greyed out.
The Allocation Request-related alerts are the following:
 | New Notes | Indicates the number of Requests with unread Notes. |
 | To Do | Indicates the number of Requests whose Workflow State is “Working”, “Rejected”, or “Reworked”. |
 | Due Soon | Indicates the number of open Requests whose Start Date (i.e., first date on which the Requested Effort > 0) falls within the Allocation Request Due Date Alert period. Settings The Allocation Request Due Date Alert period is defined by the Administrator with the “Allocation Request Problem Granularity” setting available in the System Settings workspace, Resource Settings folder, Allocations & Commitments tab, Allocations Options section. |
 | Overdue | Indicates the number of open Requests whose Start Date (i.e., first date on which the Requested Effort > 0) falls before Today’s date. |
 | To Be Accepted | Indicates the number of open Requests whose Workflow State is “Answered”. |
 | Not Synchronized | Indicates the number of Task Allocation Requests whose Requested Effort is not aligned with the Labor Assignments Total Effort (Soft Assignments or Hard Assignments, depending on the status of the request). Settings This alert is only available when the Administrator has activated the “Enable Convert Assignment into Request” setting available in the System Settings workspace, Resource Settings folder, Allocations & Commitments tab, Allocations Options section. |
Clicking on one of these alerts opens the Project Allocations full screen view, Requests tab, Requests Overview sub-tab, with the filter corresponding to the selected alert activated.
The Allocations-related alerts are the following:
| New Notes | Indicates the number of Allocations with unread Notes. |
 | Underassigned | Indicates the number of Allocated Resources whose Total Effort value (from the Assignments) falls below the Usable Effort value for the current period (according to the selection made in the Time Navigation toolbar). |
 | Overassigned | Indicates the number of Allocated Resources whose Total Effort value (from the Assignments) is greater than the Usable Effort value for the current period (according to the selection made in the Time Navigation toolbar). |
 | Not Assigned | Indicates the number of Allocated Resources with no Hard Assignment on the selected project. |
 | Not in Project Team | Indicates the number of Allocated Resources that are not yet in the Project Team. |
 | Recently Created | Indicates the number of Project Allocations whose creation date falls within the Allocation Request Due Date Alert period. Settings The Allocation Request Due Date Alert period is defined by the Administrator with the “Allocation Request Problem Granularity” setting available in the System Settings workspace, Resource Settings folder, Allocations & Commitments tab, Allocations Options section. |
 | Recently Updated | Indicates the number of Project Allocations that were last modified during the Allocation Request Due Date Alert period. Settings The Allocation Request Due Date Alert period is defined by the Administrator with the “Allocation Request Problem Granularity” setting available in the System Settings workspace, Resource Settings folder, Allocations & Commitments tab, Allocations Options section. |
Clicking on one of these alerts opens the Project Allocations full screen view, Allocations tab, Resources Overview sub-tab, with the filter corresponding to the selected alert activated.
The following links are available at the bottom of the side panel:
Dashboards – Provides access to the Project Allocations Dashboards full screen view.
Manage Snapshots – Provides access to the Project Allocations Snapshots full screen view.