The Project Allocations Snapshots full screen view allows the user to create and manage snapshots of the allocations and allocation requests data. These snapshots can then be compared with the current data.
The Snapshots tab allows the user to create and manage captured data regarding the selected project’s Allocations and Allocation Requests.
This view is made up of:
The Snapshots list and
The Snapshot Details view, which provides two view modes for the user to review the details of the selected Snapshot.
The view mode selection is available in the upper right corner of the view:
 | Requests mode |
 | Allocations mode |
The Time Navigation toolbar is also available, allowing the user to display the time-distributed data in the desired time frames and intervals.
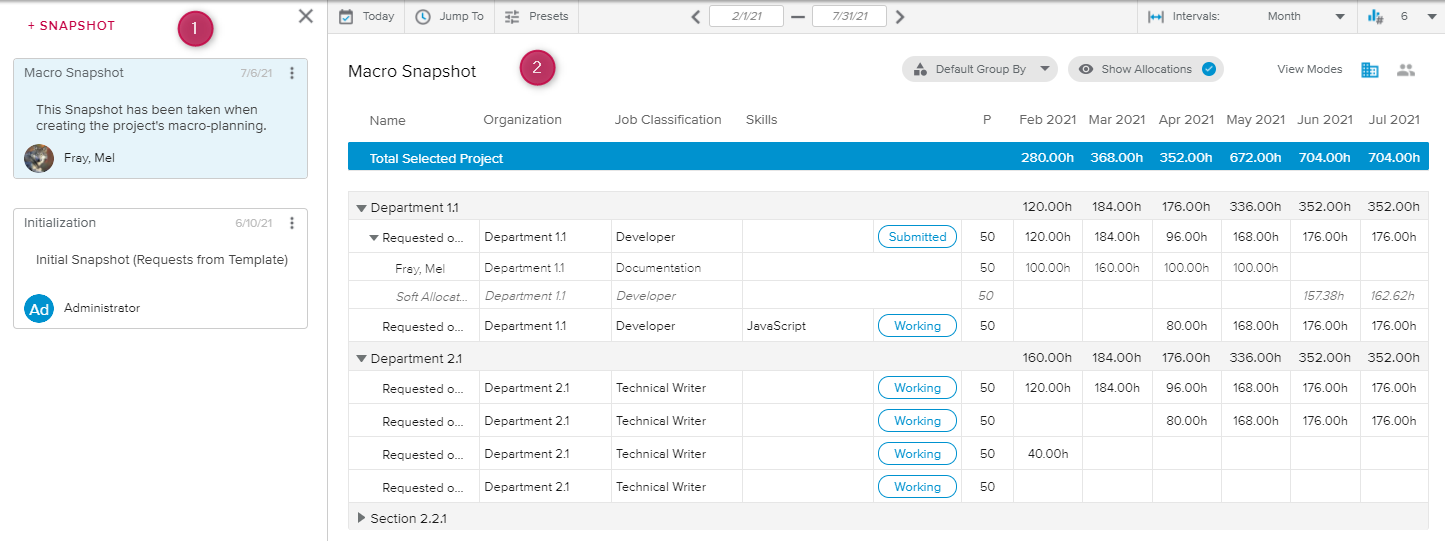
The Snapshots List panel provides a list of existing Allocation Snapshots for the selected project.
The panel can be displayed or hidden using the following buttons:
 | Show | Allows the user to display the panel. |
 | Close | Allows the user to hide the panel. |
In the upper section of the panel, the Add Snapshot ( ) command allows the user to capture the current allocation data and create a new Allocation Snapshot. Upon doing so, the user is prompted to enter a name for the Snapshot, as well as some comments.
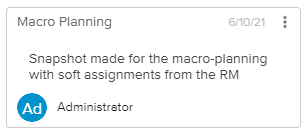
Each snapshot is represented in the form of a card displaying the Name, Creation Date, Comments, and Creator.
Clicking on the Snapshot’s name displays the corresponding information on the right-hand side of the view.
Upon clicking on the More ( ) button available in the upper right corner of the card, the following commands are available:
Edit | Opens the Edit Snapshot Definition popup, wherein the user can edit the Snapshot’s Name and Comments. |
Delete | Allows the user to delete the selected Snapshot. |
The Requests mode () provides a list of the captured allocation requests for the selected snapshot.
In addition to the time-distributed Requested Effort, the following Request attributes are displayed: Name, Organization, Job Classification, Skills, and P (for Priority).
The following display options are available:

The Allocations mode () provides a list of captured soft and hard allocations for the selected snapshot.
In addition to the time-distributed Allocated Effort, some Allocation attributes are displayed: Name of the Resource (for Hard Allocations only), Organization, Job Classification, and Skills.
The Group By ( ) display option allows the user to group the Allocations by Organization (default) or Job Classification.
The Comparison tab allows the user to compare a Snapshot’s captured data with the current values of the Allocations and Allocation Requests for the selected project.
This view is made up of:
The Snapshots list and
The Snapshot Details view, which provides two view modes for the user to compare the details of the selected Snapshot with the current data.
The view mode selection is available in the upper right corner of the view:
| Requests mode |
| Allocations mode |
The Time Navigation toolbar is also available, allowing the user to display the time-distributed data in the desired time frames and intervals.
The Snapshots List panel provides a list of existing Allocation Snapshots for the selected project.
The panel can be displayed or hidden using the following buttons:
| Show | Allows the user to display the panel. |
| Close | Allows the user to hide the panel. |
In the upper section of the panel, the Add Snapshot () command allows the user to capture the current allocation data and create a new Allocation Snapshot. Upon doing so, the user is prompted to enter a name for the Snapshot, as well as some comments.
Each snapshot is represented in the form of a card displaying the Name, Creation Date, Comments, and Creator.
Clicking on the Snapshot’s name displays the corresponding information on the right-hand side of the view.
Upon clicking on the More () button available in the upper right corner of the card, the following commands are available:
Edit | Opens the Edit Snapshot Definition popup, wherein the user can edit the Snapshot’s Name and Comments. |
Delete | Allows the user to delete the selected Snapshot. |
The Requests mode () provides a list of the captured allocation requests for the selected snapshot.
In addition to the time-distributed Requested Effort, the following Request attributes are displayed: Name, Organization, Job Classification, Skills, and P (for Priority).
The following display options are available:
The Allocations mode () provides a list of captured soft and hard allocations for the selected snapshot.
In addition to the time-distributed Allocated Effort, some Allocation attributes are displayed: Name of the Resource (for Hard Allocations only), Organization, Job Classification, and Skills.
Below each Allocation, the Current Data row provides the Allocated Effort as currently displayed in the Project Allocations full screen view, Allocations tab.
Colored indicators are provided to highlight the % shift between the captured Allocated Effort and current Allocated Effort. The user can access the legend for the colored indicators by clicking on the Legend ( ) button located in the bottom right corner of the view.
Colored Indicators are defined by the Administrator in the System Settings workspace, General Settings folder, Colored Indicators tab, Resource Utilization Preferences.
The Group By () display option allows the user to group the Allocations by Organization (default) or Job Classification.